Annual TomTom Traffic Index: Major Traffic Trends Shaping Cities Globally in 2023

Annual TomTom Traffic Index: Major Traffic Trends Shaping Cities Globally in 2023
London’s city center was the slowest to drive through in 2023, with an average speed of 15 mph.
Dublin is the most congested city at peak times in 2023, with daily commuters having lost 153 hours to traffic*.
In 2023, average speed decreased in 228 of the 387 cities analyzed, compared to 2022.
Get the full ranking and interactive report at tomtom.com/Traffic-Index
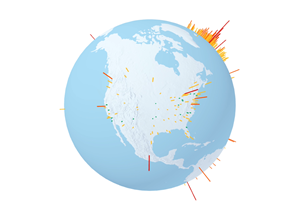
AMSTERDAM, Jan. 10, 2024 (GLOBE NEWSWIRE) -- TomTom (TOM2), the geolocation technology specialist, today releases the 13th edition of its TomTom Traffic Index, an annual report that provides data and information on traffic trends in 387 cities in 55 countries throughout 2023.
The TomTom Traffic Index is based on data from over 600 million in-car navigation systems and smartphones. For each city (both the city center and the wider metropolitan area), TomTom calculates the average travel time per mile from the time it took to cover the millions of miles driven across the entire network in the year 2023.
The trend over 2023 confirms the general decline in average speeds in most cities: of the 387 cities analyzed in the traffic index, 82 saw their average speed remain unchanged, and 77 had a higher average speed (and therefore shorter journey times) than the previous year. In the remaining 228 cities, average speeds decreased. In London and Dublin, the two cities with the lowest average speed, travel times for a 6-mile journey increased by almost 1 minute compared to 2022.
The increase in both the cost of petrol and fuel consumption, due to longer journey times, has a clear impact on the budget of motorists who have to use their car every day to get to work. In more than 60% of 351 cities where TomTom aggregates fuel prices, the average budget in fuel increased by 15% or more between 2021 and 2023. This increase in consumption had a direct impact on average CO2 emissions per vehicle.
A global challenge: Traffic congestion continues in cities worldwide
“With more than half of the world's population living in urban areas, traffic congestion and its economic, ecological and health consequences have become a problem that needs to be urgently addressed”, said Ralf-Peter Schäfer, Vice President of Traffic at TomTom. “Planning the future of urban areas is essential to ongoing traffic management. Large urban areas are harnessing Big Data to plan infrastructure and development that will alleviate traffic congestion. Analysis of historical traffic data can help growing cities map more efficient road systems and plan better zoning using location intelligence. Effective implementation of planning measures such as the implementation of LEZs to reduce air pollution will benefit from data from connected cars.”
The TomTom Traffic Index has become over time a comprehensive tool for urban planners, policymakers, and drivers, as it helps to understand and manage traffic congestion, and provides insights into the impact of congestion on a city's transportation infrastructure and economy. Real-time traffic data can feed the algorithms used by municipalities to manage traffic jams by optimizing road logistics and routes. According to a McKinsey study, this can reduce commuting times in cities by 15-20%. Data can be used to prevent traffic jams through intelligent traffic light synchronization, variable speed limits and real-time alerts showing drivers the fastest routes.
TomTom Traffic Index – 2023 Rankings
ALL-YEAR AVERAGES THROUGH 2023 (24/7)
Average travel times: in which city do people drive the slowest?
Travel time is the result of multiple factors, which can be grouped into static factors such as road network configuration, road sizes and capacities, or speed limits - plus dynamic factors like traffic congestion, roadworks, bad weather, etc., providing changes in traffic flow.
The TomTom Traffic Index shows travel times in different cities and ranks them the slowest speed in each city.
Ranking: the five slowest cities to drive in
Average travel time for a 6-mile trip in 2023, in minutes/seconds.
City center | 2023 | vs 2022 |
| Metro. Area (wider area) | 2023 | vs 2022 |
London | 36 min. 2 s. | +57 s. |
| Manila | 24 min. 37 s. | +48 s. |
Dublin | 28 min. 29 s. | +57 s. |
| Lima | 23 min. 30 s. | +28 s. |
Toronto | 28 min.. | +48 s. |
| Bengaluru | 23 min. | -38 s. |
Milan | 27 min. 50 s. | +19 s. |
| Sapporo | 22 min. 42 s. | -48 s. |
Lima | 27 min. 31 s. | +1 min.17 s. |
| Bogota | 22 min. 41 s. | -1 min.7 s. |
For the second year in a row, London was the slowest city to drive in 2023. The capital of England has the lowest base speed due to the static factors, such as the absence of any fast road, and speed limits changed to 20mph on most roads over the past years - so, even in optimal traffic conditions, the average speed in London is slower than any other city in the world.
Average time lost due to congestion in 2023
This ranking only reflects the impact of dynamic factors that increase base speed under free-flow conditions.
Ranking: The five most congested cities
Average time lost due to traffic for a 6-mile trip in 2023, in minutes/seconds.
City center | 2023 | vs 2022 |
| Metro. Area (wider area) | 2023 | vs 2022 |
London | 12 min. 5 s. | +32 s. |
| Manila | 9 min. 03 s. | +40 s. |
Mexico-city | 11 min. 40 s. | +1 min. 1 s. |
| Bogota | 8 min. 58 s. | -44 s. |
Lima | 11 min. 39 s. | +1 min. 3 s. |
| Bengaluru | 8 min. 50 s. | -32 s. |
Bengaluru | 11 min. 30 s. | -+47 s. |
| Lima | 8 min. 14 s. | +22 s. |
Dublin | 11 min. 20 s. | +31 s. |
| Mumbai | 7 min. 38 s. | -11 s. |
London's road infrastructure is not the only reason why travel times are slower than in any other city in the world: London is also the city in which motorists have lost the most time due to traffic congestion. A 6-mile journey in 2023 is 12 minutes and 5 seconds longer on average than the optimum journey time (i.e. with no traffic at all).
At the level of wide metropoles, Manila is the one in which motorists see their journey times lengthened the most compared to the optimal travel time (+9 min. 3 sec. in average, for a 6-mile trip).
The impact of driving at rush hours
Impact of peak-hour congestion on commuter travel times
Ranking : The five cities where rush-hour traffic is the most time-wasting
Average time lost in 2023 for a 6-mile daily round trip driven at morning & evening peak hours (total 12 mi/day), in hours.
City center (3mi radius around center) | Av. travel time per day | Av. time lost due to traffic | ||
per day | All year | vs. 2022 | ||
Dublin | 74 min. 21 s. | 40 min. 03 s. | 153 hrs. | +12 hrs. 31 min. |
Lima | 71 min. 18 s. | 39 min. 34 s. | 151 hrs. | +25 hrs. 19 min. |
Mexico-city | 66 min. 18 s. | 38 min. 28 s. | 147 hrs. | +19 hrs. 30 min. |
Bucharest | 71 min. 47 s. | 37 min. 49 s. | 144 hrs. | +6 hrs. 29 min. |
London | 85 min. 18 s. | 37 min. 21 s. | 143 hrs. | +8 hrs. 58 min. |
Metropolitan area | Av. travel time /day | Av. time lost due to traffic | ||
per day | All year | vs. 2022 | ||
Bogota | 56 min. 58 s. | 29 min. 31 s. | 113 hrs. | -14 hrs. 18 min. |
Manila | 60 min. 40 s. | 29 min. 31 s. | 113 hrs. | +12 hrs. 24 min. |
Lima | 59 min. 52 s. | 29 min. 20 s. | 112 hrs. | +15 hrs. 5 min. |
Bucharest | 56 min. 29 s. | 28 min. 26 s. | 108 hrs. | +3 hrs. 8 min. |
Bengaluru | 55 min. 51 s. | 27 min. 28 s. | 105 hrs. | +0 hrs. 46 min. |
Dublin is the city where commuters lose the most time in rush-hour traffic jams. A motorist spends an average of 1h14 in his or her car to make a typical 6-mile journey twice a day during the morning and evening rush hours - but more than 40 minutes of this daily round trip is due to traffic jams. Those who make this journey every day lose 153 hours in traffic jams. The situation got particularly worse in 2023, with 12 hours and 31 minutes more than in 2022.
Impact of congestion on fuel price
Ranking: Cities with highest cost of driving at rush hours
Average annual fuel cost spent for a 6-mile daily round trip driven at morning & evening peak hours (total 12 mi/day), in minutes/seconds.
City center (3mi radius) | Petrol car | Diesel car | |||||
| Annual fuel cost | Due to traffic | Annual fuel cost | Due to traffic | |||
Hong-Kong | $1 033 | $187 | $776 | $125 | |||
Paris | $970 | $299 | $832 | $238 | |||
London | $921 | $235 | $814 | $198 | |||
Zurich | $836 | $162 | $799 | $139 | |||
Athens | $834 | $229 | $639 | $159 | |||
In Hong Kong, where the petrol price is particularly high, a 6-mile round trip driven every day with a typical petrol-powered car cost a commuter US$ 1,033 in 2023; but in Paris, traffic has had a very significant impact on a daily commuter's budget, with traffic jams "costing" them almost US$ 300 in 2023, i.e. a 45% increase in the fuel budget if these trips had been made under optimal conditions.
Impact of congestion on CO2 emissions
Ranking: Cities with the highest CO2 emissions per car at rush hour
Average annual CO2 emissions based on a 6-mile daily round trip driven at morning & evening peak hours (total 12 mi/day), in kg of CO2.
City center (3mi radius) | Petrol car | Diesel car | ||
| Annual CO² emitted | Due to traffic | Annual CO² emitted | Due to traffic |
London | 1116 kg | 285 kg | 1048 kg | 255 kg |
Paris | 1077 kg | 332 kg | 1039 kg | 297 kg |
Manila | 1017 kg | 285 kg | 965 kg | 251 kg |
Bucharest | 1010 kg | 298 kg | 956 kg | 255 kg |
Ankara | 1000 kg | 197 kg | 1024 kg | 157 kg |
Notes to Editors
About the TomTom Traffic Index
Urban mobility is a key contributor to issues such as climate change, health and economic development and the TomTom Traffic Index has become the barometer of mobility patterns around the world. TomTom’s traffic data, which is powered by 600 million connected devices, is an authoritative indicator of how people move, economic activity levels, global trade and much more. For years, TomTom’s Traffic Index has been used by analysts, corporations and the media to explain a world in flux.
Which data does TomTom use for the Traffic Index?
We source our traffic flow data from over 600 million devices, such as in-dash car navigation, smartphones, personal navigation devices and telematics systems. Each day, TomTom collects from these sources over 61 billion anonymous GPS data points around the world, covering a total distance of more than 3 billion miles driven. This real-time data is archived and accessible as historical data right away. 58 billion driving hours have been accumulated in TomTom’s historical traffic data.
2023 TomTom Traffic Index methodology
Travel times and Time lost
For each city (both the city center and the wider metropolitan area), TomTom calculates the average travel time per mile from the time it took to cover the millions of miles driven across the entire network in the year 2023. This makes it possible to estimate the average time taken to cover a typical 6-mile journey in 2023, so that cities can be compared with each other, and year-on-year trends can be assessed. The TomTom Traffic Index determines the optimum travel time (no traffic) and indicates how much these travel times increase on average at different times of day and on different days of the week due to traffic conditions.
Costs of driving
TomTom defines the cost of driving as the amount of time, fuel and CO2 used per km or per mile. The cost of driving is the difference between the figures in optimal traffic conditions and the actual average figures, considering the extra amount of average time spent on the road. TomTom collects real-time fuel prices for thousands of stations around the world. To assess fuel costs, TomTom data is based on country-averaged daily pricing over 2022.
Emissions Methodology
Emission from traffic is directly proportional to a vehicle’s energy consumption. To raise those consumption models, TomTom used the PHEM (Passenger car and Heavy-duty Emission Model) simulation tool developed by the Graz University of Technology (TU Graz). PHEM calculates the energy required to perform any observed driving maneuvers (speeds, accelerations) from TomTom data for different road profiles, and estimates the resulting emissions, based on the vehicle efficiency, vehicle and energy type (petrol, diesel or electric), as well as speeds.
The TomTom Traffic Index report is available online
At tomtom.com/Traffic-Index, anyone can discover where their city ranked in 2022, how travel times changed year on year, and how much their driving habits cost.
About TomTom:
Billions of data points. Millions of sources. Hundreds of communities.
We are the mapmaker bringing it all together to build the world’s smartest map. We provide location data and technology to drivers, carmakers, businesses, and developers. Our application-ready maps, routing, real-time traffic, APIs, and SDKs enable the dreamers and doers to shape the future of mobility.
Headquartered in Amsterdam with 3,800 employees around the globe, TomTom has been helping people find their way in the world for over 30 years.
For further information:
Media Relations
Investor Relations
ir@tomtom.com
* on average, for a 6-mile trip driven twice a day (morning and evening) at rush hour
A photo accompanying this announcement is available at https://www.globenewswire.com/NewsRoom/AttachmentNg/ab72c393-8d5d-4269-8129-5c320f9cce48

