Archrock Inc (AROC): A Deep Dive into Its Performance Potential
Long-established in the Oil & Gas industry, Archrock Inc (NYSE:AROC) has enjoyed a stellar reputation. However, it has recently witnessed a daily loss of 3.7%, juxtaposed with a three-month change of 25.11%. Fresh insights from the GF Score hint at potential headwinds. Notably, its diminished rankings in financial strength, growth, and valuation suggest that the company might not live up to its historical performance. Join us as we dive deep into these pivotal metrics to unravel the evolving narrative of Archrock Inc.
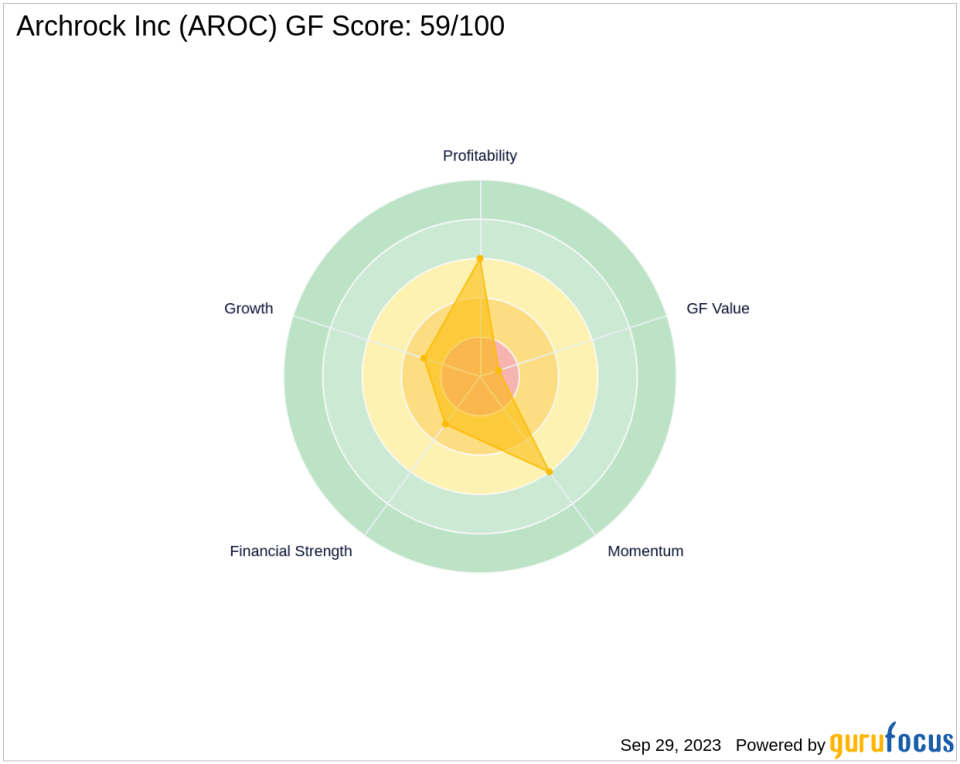
Understanding the GF Score
The GF Score is a stock performance ranking system developed by GuruFocus using five aspects of valuation, which has been found to be closely correlated to the long-term performances of stocks by backtesting from 2006 to 2021. The stocks with a higher GF Score generally generate higher returns than those with a lower GF Score. Therefore, when picking stocks, investors should invest in companies with high GF Scores. The GF Score ranges from 0 to 100, with 100 as the highest rank.
Financial strength rank: 3/10
Profitability rank: 6/10
Growth rank: 3/10
GF Value rank: 1/10
Momentum rank: 6/10
Based on the above method, GuruFocus assigned Archrock Inc the GF Score of 59 out of 100, which signals poor future outperformance potential.
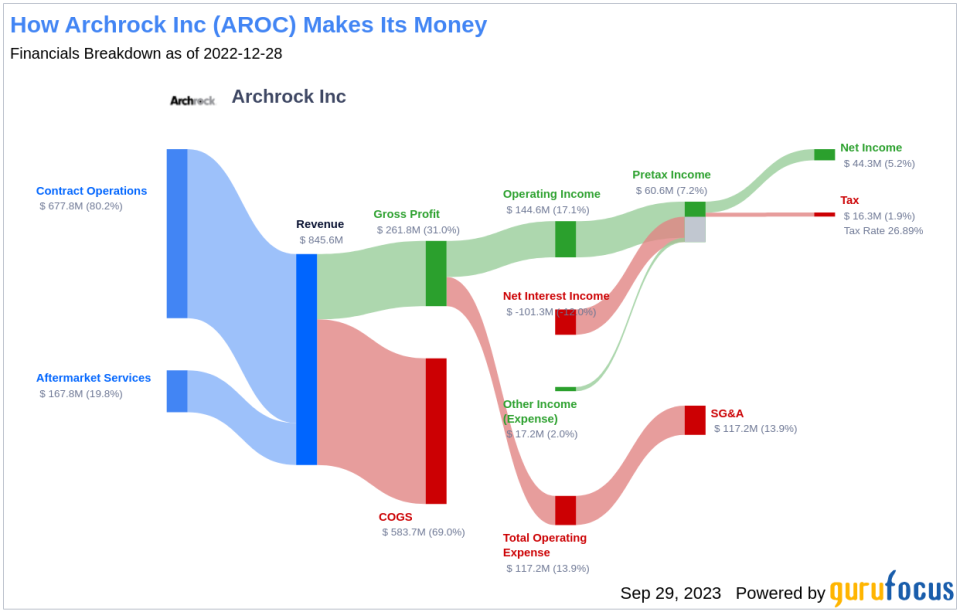
Archrock Inc: A Snapshot of the Business
Archrock Inc is an energy infrastructure company with a focus on midstream natural gas compression and a commitment to helping customers produce, compress and transport natural gas. It has two business segments, Contract Operations, and Aftermarket Services. Under the umbrella of contract operations services, the company provides operations to meet customers' natural gas compression needs. Services include designing, owning, installing, operating, and maintaining equipment. Aftermarket Services business provides a full range of services to support the compression needs of customers that own compression equipment, including operations, maintenance, overhaul and reconfiguration services and sales of parts and components. It generates maximum revenue from the Contract Operations segment.
Financial Strength Breakdown
Archrock Inc's financial strength indicators present some concerning insights about the company's balance sheet health. Archrock Inc has an interest coverage ratio of 1.79, which positions it worse than 86.7% of 767 companies in the Oil & Gas industry. This ratio highlights potential challenges the company might face when handling its interest expenses on outstanding debt. It's worth noting that the esteemed investor Benjamin Graham typically favored companies with an interest coverage ratio of at least five.
The company's Altman Z-Score is just -0.02, which is below the distress zone of 1.81. This suggests that the company may face financial distress over the next few years. Additionally, the company's low cash-to-debt ratio at 0 indicates a struggle in handling existing debt levels. Furthermore, the company's debt-to-Ebitda ratio is 4.59, which is above Joel Tillinghast's warning level of 4 and is worse than 78.4% of 713 companies in the Oil & Gas industry. Tillinghast said in his book Big Money Think's Small: Biases, Blind Spots, and Smarter Investing that a high debt-to-Ebitda ratio can be a red flag unless tangible assets cover the debt.
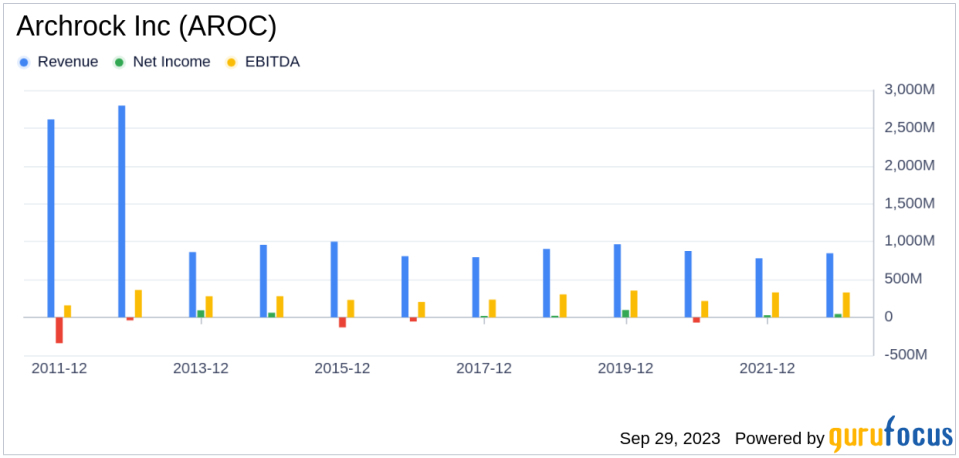
Growth Prospects
A lack of significant growth is another area where Archrock Inc seems to falter, as evidenced by the company's low Growth rank. The company's revenue has declined by -7.7 per year over the past three years, which underperforms worse than 81.21% of 862 companies in the Oil & Gas industry. Stagnating revenues may pose concerns in a fast-evolving market.
Over the past five years, Archrock Inc has witnessed a decline in its earnings before interest, taxes, depreciation, and amortization (EBITDA). The three-year growth rate is recorded at -5.9, while the five-year growth rate is at -9.7. These figures underscore potential challenges in the company's profitability. Lastly, Archrock Inc predictability rank is just one star out of five, adding to investor uncertainty regarding revenue and earnings consistency.
Conclusion
Given Archrock Inc's financial strength, profitability, and growth metrics, the GF Score highlights the firm's unparalleled position for potential underperformance. While the company has a rich history in the Oil & Gas industry, its current financial health and growth prospects raise concerns about its ability to maintain its historical performance. Investors should consider these factors when making investment decisions.
GuruFocus Premium members can find more companies with strong GF Scores using the following screener link: GF Score Screen
This article first appeared on GuruFocus.
