Is Arrowhead Pharmaceuticals (ARWR) Too Good to Be True? A Comprehensive Analysis of a ...
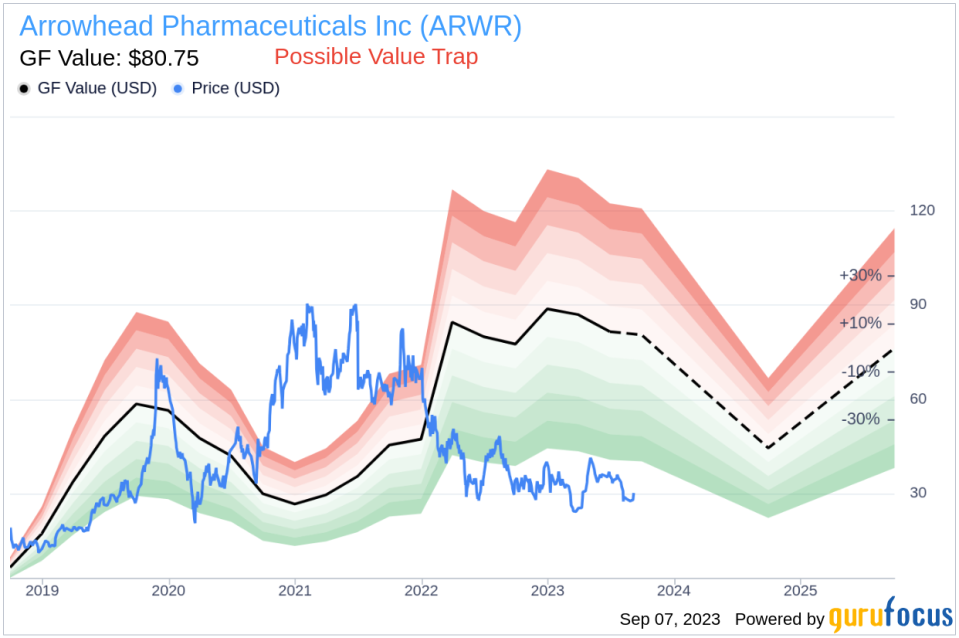
For value-focused investors, the quest for stocks trading below their intrinsic value is relentless. One such stock that has caught the attention of many is Arrowhead Pharmaceuticals Inc (NASDAQ:ARWR). Currently priced at $30.22, the stock recorded a daily gain of 3.42% but a 3-month decrease of 17.11%. According to its GF Value, the fair valuation of the stock is $80.75.
Understanding the GF Value
The GF Value is an exclusive method that calculates the current intrinsic value of a stock. The GF Value Line, visible on our summary page, provides an overview of the fair value at which the stock should ideally be traded. The calculation is based on three factors: historical multiples (PE Ratio, PS Ratio, PB Ratio and Price-to-Free-Cash-Flow) that the stock has traded at, GuruFocus adjustment factor based on the company's past returns and growth, and future estimates of the business performance.
We believe that the stock price will most likely fluctuate around the GF Value Line. If the stock price is significantly above the GF Value Line, it is overvalued and its future return is likely to be poor. Conversely, if it is significantly below the GF Value Line, its future return will likely be higher.
Delving Deeper: The Risk Factors
Despite its seemingly attractive valuation, certain risk factors associated with Arrowhead Pharmaceuticals should not be ignored. These risks are primarily reflected through its low Piotroski F-score and a Beneish M-Score of 1.33 that exceeds -1.78, the threshold for potential earnings manipulation. These indicators suggest that Arrowhead Pharmaceuticals, despite its apparent undervaluation, might be a potential value trap. This complexity underlines the importance of thorough due diligence in investment decision-making.
Understanding the Beneish M-Score
Developed by Professor Messod Beneish, the Beneish M-Score is based on eight financial variables that reflect different aspects of a company's financial performance and position. These are Days Sales Outstanding (DSO), Gross Margin (GM), Total Long-term Assets Less Property, Plant and Equipment over Total Assets (TATA), change in Revenue (?REV), change in Depreciation and Amortization (?DA), change in Selling, General and Admin expenses (?SGA), change in Debt-to-Asset Ratio (?LVG), and Net Income Less Non-Operating Income and Cash Flow from Operations over Total Assets (?NOATA).
Company Snapshot: Arrowhead Pharmaceuticals
Arrowhead Pharmaceuticals Inc is an American biotechnology company. Its primary focus is the development of medicine to treat diseases with a genetic origin, characterized by the overproduction of one or more proteins. Its medical solutions are aimed at the genes that trigger the diseases. Its portfolio includes drugs targeting hepatitis B, Alpha-1 Antitrypsin Deficiency, thrombosis and angioedema, clear-cell and renal cell carcinoma, and cardiovascular disease.
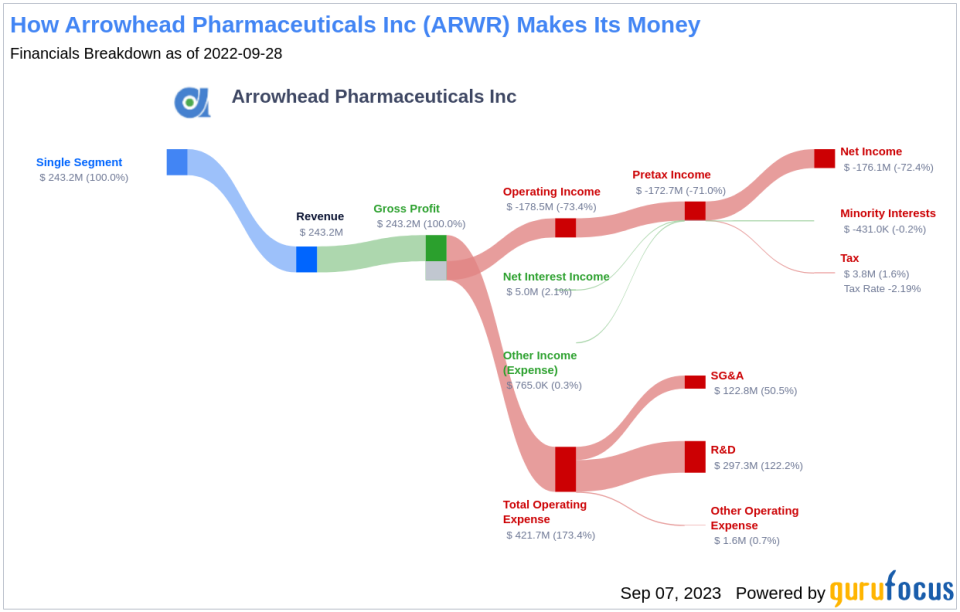
Financial Metrics: A Deeper Analysis
The days sales outstanding (DSO) is an important financial metric that denotes the average time a company takes to collect payment after a sale is completed. Looking at the historical data from the past three years (2021: 0.18; 2022: 0.35; 2023: 0.32), there appears to be a rising trend in Arrowhead Pharmaceuticals's DSO.
The Gross Margin index tracks the evolution of a company's gross profit as a proportion of its revenue. A downward trend could indicate issues such as overproduction or more generous credit terms, both of which are potential red flags for earnings manipulation. By examining the past three years of Arrowhead Pharmaceuticals's historical data (2021: 0; 2022: 0; 2023: 0), we find that its Gross Margin has contracted by 0%.

Next is the leverage index, which is computed as the change in the Debt-to-Asset Ratio. An increase in this ratio may suggest that the company is taking on more debt, thereby potentially inflating earnings.
The TATA (Total Accruals to Total Assets) ratio, calculated as the Net Income less Non-Operating Income and Cash Flow from Operations, divided by Total Assets, is a key indicator of the quality of a company's earnings. For Arrowhead Pharmaceuticals, the current TATA ratio (TTM) stands at 0.019.
Conclusion: A Potential Value Trap?
Based on the comprehensive analysis of Arrowhead Pharmaceuticals, the company appears to be a potential value trap. Despite its seemingly undervalued status, the low Piotroski F-score and high Beneish M-Score, along with other financial indicators, suggest potential risks. Therefore, investors should exercise caution and conduct thorough due diligence before making an investment decision.
To find out the high quality companies that may deliver above average returns, please check out GuruFocus High Quality Low Capex Screener.
This article first appeared on GuruFocus.
