Arthur J. Gallagher (AJG) Q2 Earnings & Revenues Top Estimates
Arthur J. Gallagher & Co. AJG reported second-quarter 2023 adjusted net earnings of $1.90 per share, which beat the Zacks Consensus Estimate by 2.1%. The bottom line increased 16.5% on a year-over-year basis.
Arthur J. Gallagher’s performance was driven by higher adjusted revenues and margin expansion across the Brokerage and Risk Management segments, partially offset by higher expenses.
Arthur J. Gallagher & Co. Price, Consensus and EPS Surprise
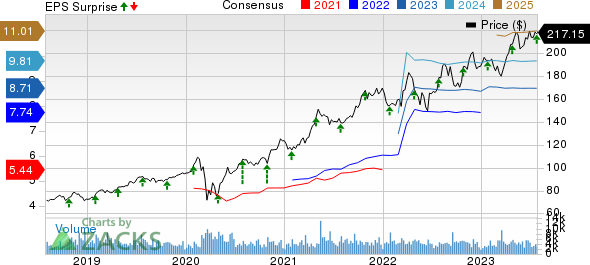
Arthur J. Gallagher & Co. price-consensus-eps-surprise-chart | Arthur J. Gallagher & Co. Quote
Operational Update
Total revenues of $2.4 billion beat the Zacks Consensus Estimate by 2.4%. The top line also improved 19.8% year over year.
Arthur J. Gallagher’s total expenses increased 26.8% year over year to $2.1 billion in the reported quarter due to higher compensation, operating, reimbursements, interest and amortization. The figure was higher than our estimate of $2 billion.
Adjusted earnings before interest, tax, depreciation and amortization and change in estimated acquisition earnout payables (EBITDAC) grew 19% from the prior-year quarter to $675.7 million. The figure was higher than our estimate of $628.9 million.
Segmental Results
Brokerage: Revenues of $2 billion increased 21% year over year on higher commissions, fees, supplemental revenues, contingent revenues, investment income and net gains on divestitures. The figure matched the Zacks Consensus Estimate as well as our estimate.
Expenses jumped 27.6% from the year-ago quarter to $1.6 billion due to higher compensation, operating, amortization and depreciation. Our estimate was $1.5 billion.
Adjusted EBITDAC climbed 22.9% from the year-ago level to $669.3 million and the margin expanded 50 basis points (bps) to 32.1%.
Risk Management: Revenues were up 20% year over year to $318.5 million, mainly owing to higher fees. Our estimate was $321.5 million.
Expenses rose 15.4% from the prior-year period to $303.7 million on higher compensation, operating and reimbursements. Our estimate was $283.9 million.
Adjusted EBITDAC improved 24% year over year to $61.7 million and margin expanded 70 bps to 19.4%.
Corporate: EBITDAC was a negative $55.3 million compared with negative $26.3 million in the year-ago quarter.
Financial Update
As of Jun 30, 2023, total assets were $54.3 billion, up 41.7% from the 2022-end level.
At the end of the quarter, cash and cash equivalents of $952.3 million increased 28.9% from the 2022-end level.
As of Jun 30, 2023, shareholders’ equity increased 13.5% to $10.4 billion from the level on Dec 31, 2022.
Dividend Update
The board of directors approved a quarterly cash dividend of 55 cents per share. The dividend will be paid out on Sep 15, 2023 to shareholders of record as of Sep 1.
Acquisition Update
In the quarter, Arthur J. Gallagher closed 15 acquisitions with estimated annualized revenues of about $349.1 million.
Zacks Rank and Performance of Other Insurers
Currently, AJG carries a Zacks Rank #3 (Hold). You can see the complete list of today’s Zacks #1 Rank (Strong Buy) stocks here.
Marsh & McLennan Companies, Inc. MMC reported second-quarter 2023 adjusted earnings per share of $2.20, which beat the Zacks Consensus Estimate by 3.8%. The bottom line improved 16% year over year.
Consolidated revenues of MMC advanced 9% year over year to $5,876 million. The figure rose 11% on an underlying basis in the quarter under review. The top line outpaced the consensus mark by 2.5%. Total operating expenses of $4,419 million escalated 10.1% year over year in the second quarter. Total expenses increased 9.3% year over year at the Risk and Insurance Services segment, while the same in the Consulting segment witnessed a 10.9% year-over-year increase.
Adjusted operating income improved 17% year over year to $1,540 million but missed our estimate of $1,701.3 million. The adjusted operating margin of 27.7% improved 100 basis points year over year in the quarter under review but came lower than our estimate of 30.2%.
Brown & Brown, Inc.’s BRO second-quarter 2023 adjusted earnings of 68 cents per share beat the Zacks Consensus Estimate by 15.2%. The bottom line increased 33.3% year over year. Total revenues of $1.1 billion beat the Zacks Consensus Estimate by 5.1%. The top line improved 25% year over year. The upside can be primarily attributed to commission and fees, which grew 23.5% year over year to $1 billion. Our estimate for commission and fees growth was 13.7%.
Organic revenues improved 11.2% to $894.3 million in the quarter under review. Investment income increased year over year to $10.3 million from $0.4 million in the year-ago quarter. The Zacks Consensus Estimate for the metric was pegged at $6.1 million and our estimate was $4.6 million.
Adjusted EBITDAC was $358.4 million, up 30.5% year over year. EBITDAC margin expanded 150 basis points year over year to 35.7%. Our estimate for adjusted EBITDAC was $207.5 million. Total expenses increased 23.7% to $792.9 million. Our estimate was $751.3 million.
Kinsale Capital Group KNSL delivered second-quarter 2023 net operating earnings of $2.88 per share, which outpaced the Zacks Consensus Estimate by 14.7%. The bottom line improved 50% year over year. Gross written premiums of $438.2 million rose 58.2% year over year. Our estimate was $343.2 million. Net written premiums climbed 41% year over year to $242.3 million in the quarter. Our estimate was loss of $282.2 million.
Net investment income more than doubled year over year to $24.2 million in the quarter and beat our estimate of $14.9 million. The Zacks Consensus Estimate was pegged at $20.7 million. Total expenses increased 35.8% year over year to $205.6 million. Our estimate was $197.9 million. Kinsale Capital’s underwriting income of $61.5 million soared 39.3% year over year. The combined ratio improved 70 bps to 76.7 in the quarter under review.
Want the latest recommendations from Zacks Investment Research? Today, you can download 7 Best Stocks for the Next 30 Days. Click to get this free report
Marsh & McLennan Companies, Inc. (MMC) : Free Stock Analysis Report
Arthur J. Gallagher & Co. (AJG) : Free Stock Analysis Report
Brown & Brown, Inc. (BRO) : Free Stock Analysis Report
Kinsale Capital Group, Inc. (KNSL) : Free Stock Analysis Report
