Asana Inc (ASAN): A Deep Dive into Its Performance Potential
Long-established in the Software industry, Asana Inc (NYSE:ASAN) has enjoyed a stellar reputation. However, it has recently witnessed a decline of 3.16%, juxtaposed with a three-month change of -27.77%. Fresh insights from the GuruFocus Score Rating hint at potential headwinds. Notably, its diminished rankings in financial strength, growth, and valuation suggest that the company might not live up to its historical performance. Join us as we dive deep into these pivotal metrics to unravel the evolving narrative of Asana Inc.
Understanding the GF Score
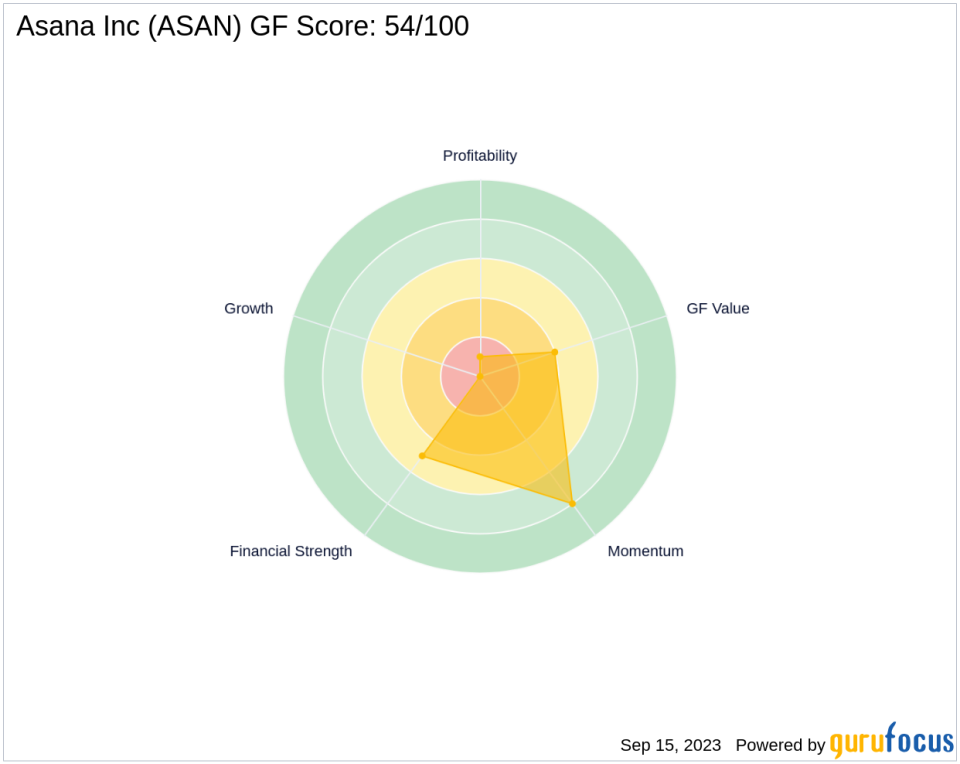
The GF Score is a stock performance ranking system developed by GuruFocus using five aspects of valuation, which has been found to be closely correlated to the long-term performances of stocks by backtesting from 2006 to 2021. The stocks with a higher GF Score generally generate higher returns than those with a lower GF Score. Therefore, when picking stocks, investors should invest in companies with high GF Scores. The GF Score ranges from 0 to 100, with 100 as the highest rank.
Financial strength rank: 5/10
Profitability rank: 1/10
Growth rank: 0/10
GF Value rank: 4/10
Momentum rank: 8/10
Based on the above method, GuruFocus assigned Asana Inc the GF Score of 54 out of 100, which signals poor future outperformance potential.
Asana Inc: A Snapshot of Its Business
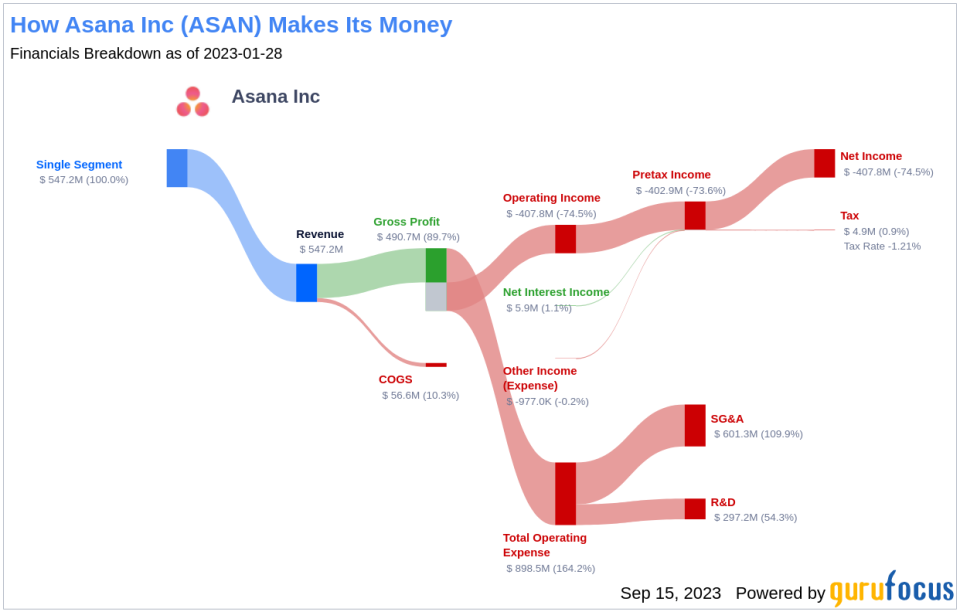
Asana Inc, with a market cap of $3.97 billion, is a software company that provides a platform for work management. It helps teams orchestrate work, from daily tasks to cross-functional strategic initiatives. The platform is used to plan marketing campaigns, streamline processes, manage sales, and manage product launches. Asana Inc also provides project management and workflow management solutions. The company's sales stand at $606.54 million, but it has an operating margin of -55.88%, indicating potential profitability issues.
Financial Strength Analysis
Asana Inc's financial strength indicators present some concerning insights about the company's balance sheet health. The company has an interest coverage ratio of 0, which positions it worse than 0% of 1551 companies in the Software industry. This ratio highlights potential challenges the company might face when handling its interest expenses on outstanding debt. The company's Altman Z-Score is just 1.9, which is below the safe threshold of 2.99. Although this does not imply immediate danger of financial distress, the stock may face some financial struggles if the Altman Z-score drops below 1.81.
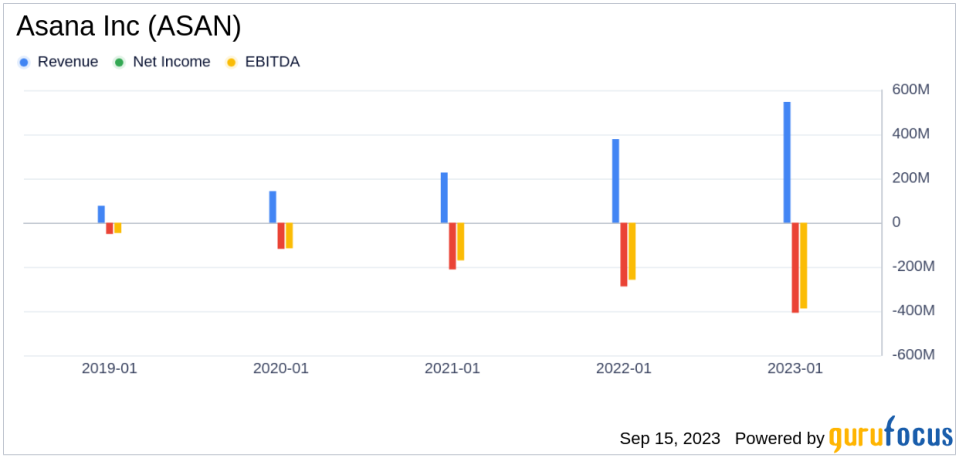
Profitability Analysis
Asana Inc's low Profitability rank can also raise warning signals. The company's Operating Margin has declined over the past five years ((-67,763.00%)), as shown by the following data: 2019: -67.75; 2020: -83.89; 2021: -77.34; 2022: -70.07; 2023: -74.53; .
Growth Prospects
A lack of significant growth is another area where Asana Inc seems to falter, as evidenced by the company's low Growth rank.
Conclusion
Given Asana Inc's financial strength, profitability, and growth metrics, the GuruFocus Score Rating highlights the firm's unparalleled position for potential underperformance. While the company has a strong reputation in the software industry, its current financial indicators suggest that it may struggle to maintain its historical performance. Therefore, investors should exercise caution when considering this stock.
GuruFocus Premium members can find more companies with strong GF Scores using the following screener link: GF Score Screen
This article first appeared on GuruFocus.
