Asbury (ABG) Q2 Earnings & Revenues Beat Estimates
Asbury Automotive Group ABG reported second-quarter 2023 adjusted earnings of $8.95 per share, which decreased 10.9% year over year. Earnings, however, topped the Zacks Consensus Estimate of $8.15 per share.
In the reported quarter, revenues amounted to $3,742.5 million, down 5% year over year. The top line, however, surpassed the Zacks Consensus Estimate of $3,741 million.
Asbury Automotive Group, Inc. Price, Consensus and EPS Surprise
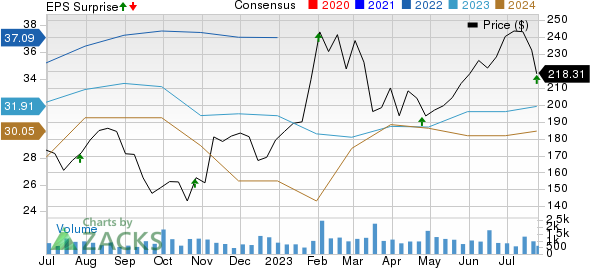
Asbury Automotive Group, Inc. price-consensus-eps-surprise-chart | Asbury Automotive Group, Inc. Quote
Segment Details
In the quarter, new-vehicle revenues rose 4% year over year to $1,942.7 million, beating the Zacks Consensus Estimate of $1,849 million. Gross profit from the segment came in at $185 million, contracting 16.1% from the prior-year quarter but topping the consensus mark of $177 million.
Used-vehicle revenues slid 19% from the year-ago figure to $1,107.3 million, missing the consensus mark of $1,135 million. Gross profit from the segment came in at $71 million, which fell 31.7% and missed the Zacks Consensus Estimate of $73 million.
Net revenues in the finance and insurance businesses amounted to $166.3 million, down 18% from the year-ago quarter and lagging the consensus mark of $168 million. Gross profit was $165 million, declining 12.2% year over year but outpacing the Zacks Consensus Estimate of $164 million.
Revenues from the parts and service business rose 1% from the prior-year quarter to $526.1 million but missed the consensus mark of $546 million. Gross profit from this segment came in at $292 million, inching up 0.7% year over year but missing the consensus estimate of $299 million.
Other Tidbits
Adjusted selling, general & administrative (SG&A) expenses as a percentage of gross profit rose to 57%, marking an increase of 112 basis points year over year. Asbury sold over 11,400 vehicles, an all-time record high, through the “end-to-end” online sales platform, Clicklane.
As of Jun 30, 2023, the company had cash and cash equivalents of $77.5 million, down from $235.3 million on Dec 31, 2022. It had long-term debt of $3,240.5 million as of Jun 30, 2023, down from $3,301.2 million on Dec 31, 2022.
During the quarter under review, Asbury repurchased approximately 960,000 shares for nearly $190 million. On Jul 24, 2023, Asbury had $250 million in share repurchase authorization remaining.
Zacks Rank & Key Picks
ABG currently carries a Zacks Rank #2 (Buy).
A few other top-ranked players in the auto space include Ford Motor Company F, Lear Corporation LEA and Oshkosh Corporation OSK. While F sports a Zacks Rank #1 (Strong Buy), LEA and OSK each carry a Zacks Rank #2. You can see the complete list of today’s Zacks #1 Rank stocks here.
The Zacks Consensus Estimate for F’s 2023 sales implies year-over-year growth of 4.9%. The 2023 EPS estimate has been revised upward by 4 cents in the past 30 days. The EPS estimate for 2024 has moved north by 3 cents in the past 30 days.
The Zacks Consensus Estimate for LEA’s 2023 sales and earnings implies year-over-year growth of 14.1% and 75.4%, respectively. The EPS estimate for 2023 has moved north by 20 cents in the past seven days. The 2024 EPS estimate has moved up by 8 cents in the past seven days.
The Zacks Consensus Estimate for OSK’s 2023 sales and earnings implies year-over-year growth of 8.6% and 295.1%, respectively. The EPS estimate for 2023 has moved up by a cent in the past seven days. The 2024 EPS estimate has remained unchanged in the past seven days.
Want the latest recommendations from Zacks Investment Research? Today, you can download 7 Best Stocks for the Next 30 Days. Click to get this free report
Ford Motor Company (F) : Free Stock Analysis Report
Lear Corporation (LEA) : Free Stock Analysis Report
Asbury Automotive Group, Inc. (ABG) : Free Stock Analysis Report
Oshkosh Corporation (OSK) : Free Stock Analysis Report
