Ashland's (ASH) Earnings and Sales Miss Estimates in Q3
Ashland Global Holdings Inc. ASH recorded third-quarter fiscal 2023 (ending Jun 30, 2023) adjusted earnings of $1.23 per share, down from $1.89 in the prior-year quarter. The bottom line missed the Zacks Consensus Estimate of $1.40
Sales were down 15% year over year to $546 million. The top line missed the Zacks Consensus Estimate of $547.2 million. The sales were adversely impacted by lower volumes from customer inventory destocking, partly offset by favorable pricing.
Ashland Inc. Price, Consensus and EPS Surprise
Ashland Inc. price-consensus-eps-surprise-chart | Ashland Inc. Quote
Segment Highlights
Life Sciences: Sales in the segment fell 4% from the prior year to $219 million in the reported quarter, with pharmaceutical clients experiencing an increase due to improved mix and cost recovery. Customers destocking in nutrition and nutraceutical ingredients more than offset this growth. The figure missed our estimate of $242.5 million.
Personal Care: Sales in the division fell 15% year over year to $146 million. Continuous inventory destocking by customers serving the personal-care end markets more than offset disciplined pricing across end markets. The figure missed our estimate of $173.5 million.
Specialty Additives: Sales in the segment fell 22% year over year to $152 million, hurt by the inventory destocking that more than offset sustained inflation recovery. The figure missed our estimate of $163.9 million.
Intermediates: Sales in the segment went down 41% year over year to $43 million, affected by lower pricing and volumes of captive butanediol and merchant-derivatives sales. The figure missed our estimate of $56.4 million.
Financials
Operating activities generated $137 million in cash flows in the reported quarter against usage of $17 million in the same period last year. Ongoing free cash flow was $97 million, up from $13 million.
Outlook
Ashland expects continued customer destocking and external uncertainties for the remainder of fiscal 2023. The company expects adjusted EBITDA for the fiscal year to be roughly $500 million. It estimates sales for fiscal 2023 to be around $2.2 billion.
Price Performance
Shares of Ashland have lost 10.4% in the past year against a 13.7% rise of the industry.
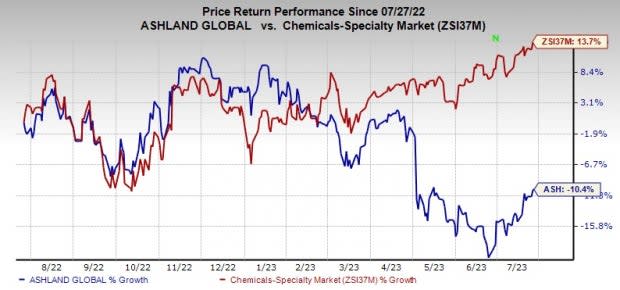
Image Source: Zacks Investment Research
Zacks Rank & Key Picks
Ashland currently carries a Zacks Rank #5 (Strong Sell).
Better-ranked stocks worth considering in the basic materials space include PPG Industries Inc. PPG, ATI Inc. ATI and Carpenter Technology Corporation CRS.
PPG, currently carrying a Zacks Rank #1 (Strong Buy), has an expected earnings growth rate of 20.8% for the current fiscal year. The Zacks Consensus Estimate for PPG's earnings for the current fiscal year has been revised 1.6% upward in the past 60 days. It delivered an earnings surprise of 7.3% each of the trailing four quarters, on average. PPG has gained around 16.5% over a year. You can see the complete list of today’s Zacks #1 Rank stocks here.
ATI, currently carrying a Zacks Rank #2 (Buy), has a projected earnings growth rate of 13.1% for the current year. Its earnings beat the Zacks Consensus Estimate in each of the last four quarters. It has a trailing four-quarter earnings surprise of roughly 13%, on average. ATI shares are up around 97.3% in a year.
CRS, currently carrying a Zacks Rank #1, has a projected earnings growth rate of 198.11% for the current year. Its earnings beat the Zacks Consensus Estimate in each of the last four quarters. It has a trailing four-quarter earnings surprise of roughly 30.9%, on average. CRS shares are up around 97% in a year.
Want the latest recommendations from Zacks Investment Research? Today, you can download 7 Best Stocks for the Next 30 Days. Click to get this free report
ATI Inc. (ATI) : Free Stock Analysis Report
PPG Industries, Inc. (PPG) : Free Stock Analysis Report
Ashland Inc. (ASH) : Free Stock Analysis Report
Carpenter Technology Corporation (CRS) : Free Stock Analysis Report
