Should AssetCo plc’s (LON:ASTO) Weak Investment Returns Worry You?

Today we are going to look at AssetCo plc (LON:ASTO) to see whether it might be an attractive investment prospect. Specifically, we'll consider its Return On Capital Employed (ROCE), since that will give us an insight into how efficiently the business can generate profits from the capital it requires.
First up, we'll look at what ROCE is and how we calculate it. Second, we'll look at its ROCE compared to similar companies. Finally, we'll look at how its current liabilities affect its ROCE.
What is Return On Capital Employed (ROCE)?
ROCE is a metric for evaluating how much pre-tax income (in percentage terms) a company earns on the capital invested in its business. In general, businesses with a higher ROCE are usually better quality. In brief, it is a useful tool, but it is not without drawbacks. Renowned investment researcher Michael Mauboussin has suggested that a high ROCE can indicate that 'one dollar invested in the company generates value of more than one dollar'.
So, How Do We Calculate ROCE?
Analysts use this formula to calculate return on capital employed:
Return on Capital Employed = Earnings Before Interest and Tax (EBIT) ÷ (Total Assets - Current Liabilities)
Or for AssetCo:
0.046 = UK£1.4m ÷ (UK£32m - UK£2.1m) (Based on the trailing twelve months to March 2019.)
So, AssetCo has an ROCE of 4.6%.
See our latest analysis for AssetCo
Does AssetCo Have A Good ROCE?
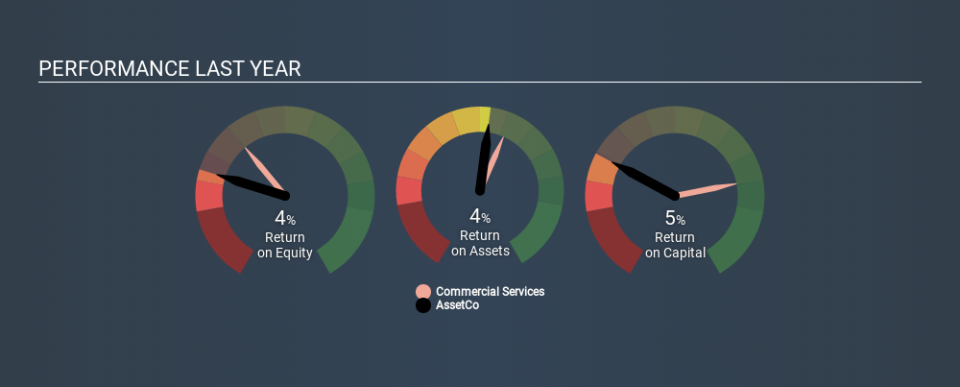
ROCE is commonly used for comparing the performance of similar businesses. In this analysis, AssetCo's ROCE appears meaningfully below the 10% average reported by the Commercial Services industry. This could be seen as a negative, as it suggests some competitors may be employing their capital more efficiently. Separate from how AssetCo stacks up against its industry, its ROCE in absolute terms is mediocre; relative to the returns on government bonds. Investors may wish to consider higher-performing investments.
AssetCo's current ROCE of 4.6% is lower than its ROCE in the past, which was 21%, 3 years ago. This makes us wonder if the business is facing new challenges. The image below shows how AssetCo's ROCE compares to its industry, and you can click it to see more detail on its past growth.
Remember that this metric is backwards looking - it shows what has happened in the past, and does not accurately predict the future. ROCE can be misleading for companies in cyclical industries, with returns looking impressive during the boom times, but very weak during the busts. ROCE is only a point-in-time measure. How cyclical is AssetCo? You can see for yourself by looking at this free graph of past earnings, revenue and cash flow.
What Are Current Liabilities, And How Do They Affect AssetCo's ROCE?
Current liabilities are short term bills and invoices that need to be paid in 12 months or less. Due to the way the ROCE equation works, having large bills due in the near term can make it look as though a company has less capital employed, and thus a higher ROCE than usual. To counter this, investors can check if a company has high current liabilities relative to total assets.
AssetCo has total assets of UK£32m and current liabilities of UK£2.1m. Therefore its current liabilities are equivalent to approximately 6.4% of its total assets. With low levels of current liabilities, at least AssetCo's mediocre ROCE is not unduly boosted.
What We Can Learn From AssetCo's ROCE
Based on this information, AssetCo appears to be a mediocre business. You might be able to find a better investment than AssetCo. If you want a selection of possible winners, check out this free list of interesting companies that trade on a P/E below 20 (but have proven they can grow earnings).
If you like to buy stocks alongside management, then you might just love this free list of companies. (Hint: insiders have been buying them).
If you spot an error that warrants correction, please contact the editor at editorial-team@simplywallst.com. This article by Simply Wall St is general in nature. It does not constitute a recommendation to buy or sell any stock, and does not take account of your objectives, or your financial situation. Simply Wall St has no position in the stocks mentioned.
We aim to bring you long-term focused research analysis driven by fundamental data. Note that our analysis may not factor in the latest price-sensitive company announcements or qualitative material. Thank you for reading.
