Atlantica Sustainable Infrastructure PLC (AY): A Deep Dive into Its Performance Metrics
Long-established in the Utilities - Independent Power Producers industry, Atlantica Sustainable Infrastructure PLC (NASDAQ:AY) has enjoyed a stellar reputation. However, it has recently witnessed a daily loss of 2.94%, juxtaposed with a three-month change of -14.03%. Fresh insights from the GF Score hint at potential headwinds. Notably, its diminished rankings in financial strength, growth, and valuation suggest that the company might not live up to its historical performance. Join us as we dive deep into these pivotal metrics to unravel the evolving narrative of Atlantica Sustainable Infrastructure PLC.
Understanding the GF Score
The GF Score is a stock performance ranking system developed by GuruFocus using five aspects of valuation, which has been found to be closely correlated to the long-term performances of stocks by backtesting from 2006 to 2021. The stocks with a higher GF Score generally generate higher returns than those with a lower GF Score. Therefore, when picking stocks, investors should invest in companies with high GF Scores. The GF Score ranges from 0 to 100, with 100 as the highest rank.
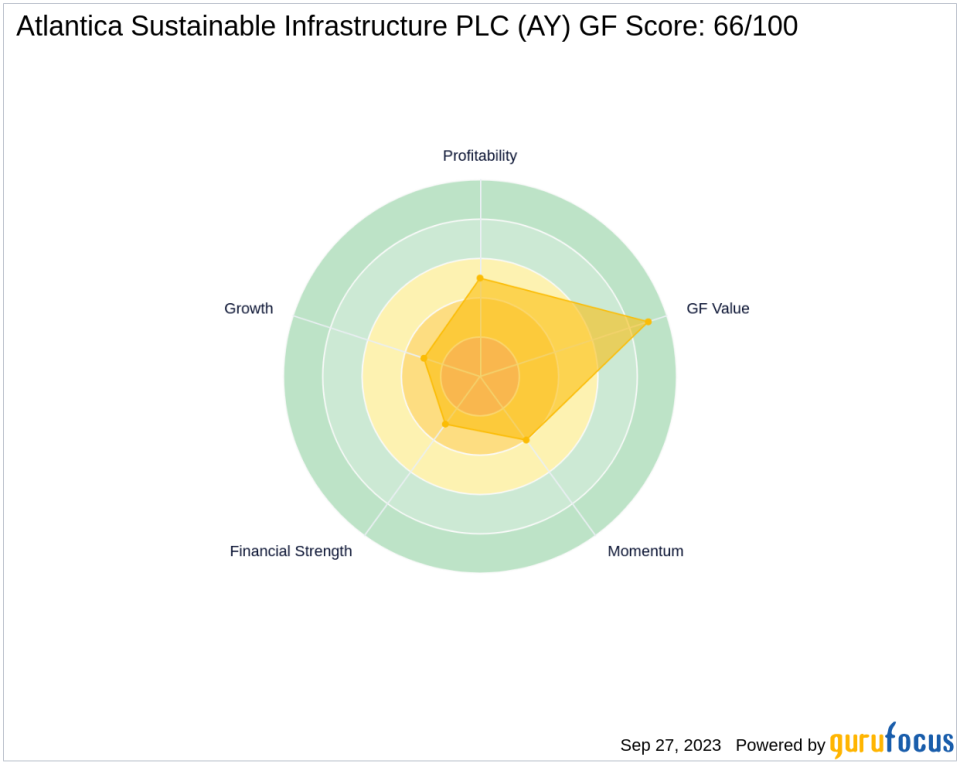
Financial strength rank: 3/10
Profitability rank: 5/10
Growth rank: 3/10
GF Value rank: 9/10
Momentum rank: 4/10
Based on the above method, GuruFocus assigned Atlantica Sustainable Infrastructure PLC the GF Score of 66 out of 100, which signals poor future outperformance potential.
Atlantica Sustainable Infrastructure PLC: A Snapshot
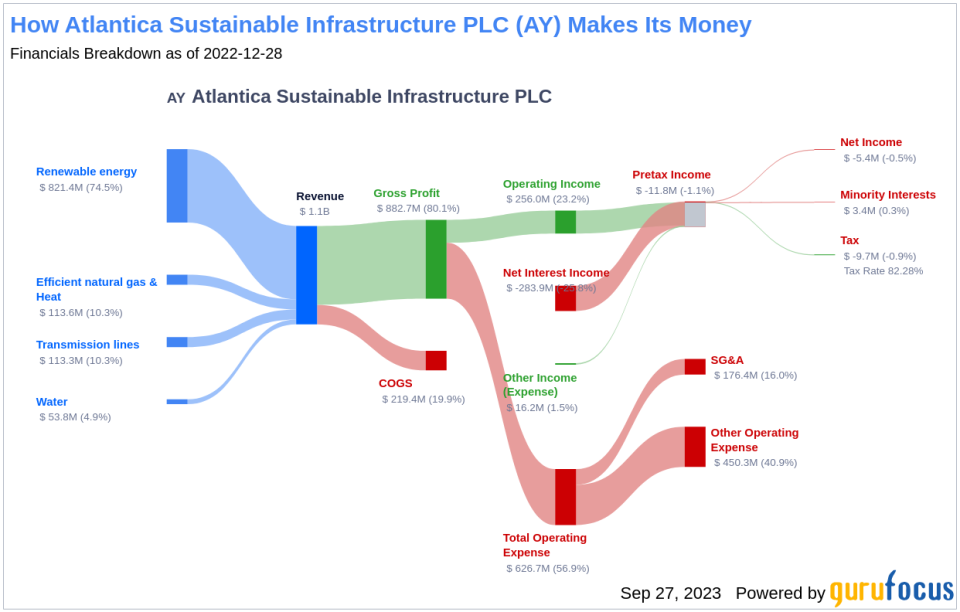
Atlantica Sustainable Infrastructure PLC owns, manages, and acquires renewable energy, conventional power, electric transmission lines, and water assets. It is focused on North America (the United States and Mexico), South America (Peru, Chile, Brazil, and Uruguay), and EMEA (Spain, Algeria, and South Africa). The company's segments include North America, South America, and Europe, Middle East, and Africa. The renewable energy sector includes the company's activities related to the production of electricity from solar power and wind plants. Atlantica derives most of its revenues from EMEA, followed by South America and North America.
Financial Strength Analysis
Atlantica Sustainable Infrastructure PLC's financial strength indicators present some concerning insights about the company's balance sheet health. The company's interest coverage ratio of 0.83 positions it worse than 87.97% of 316 companies in the Utilities - Independent Power Producers industry. This ratio highlights potential challenges the company might face when handling its interest expenses on outstanding debt. It's worth noting that the esteemed investor Benjamin Graham typically favored companies with an interest coverage ratio of at least five.
The company's Altman Z-Score is just 0.45, which is below the distress zone of 1.81. This suggests that the company may face financial distress over the next few years. Additionally, the company's low cash-to-debt ratio at 0.12 indicates a struggle in handling existing debt levels. The company's debt-to-equity ratio is 3.64, which is worse than 90.45% of 377 companies in the Utilities - Independent Power Producers industry. A high debt-to-equity ratio suggests over-reliance on borrowing and vulnerability to market fluctuations.
Additionally, the company's debt-to-Ebitda ratio is 6.98, which is above Joel Tillinghast's warning level of 4 and is worse than 63.17% of 315 companies in the Utilities - Independent Power Producers industry. Tillinghast said in his book Big Money Think's Small: Biases, Blind Spots, and Smarter Investing that a high debt-to-Ebitda ratio can be a red flag unless tangible assets cover the debt.
Profitability Analysis
Atlantica Sustainable Infrastructure PLC's low Profitability rank can also raise warning signals. Atlantica Sustainable Infrastructure PLC's Operating Margin has declined over the past five years ((-50.31%)), as shown by the following data: 2018: 46.74; 2019: 46.05; 2020: 32.82; 2021: 28.06; 2022: 23.23. Additionally, Atlantica Sustainable Infrastructure PLC's Gross Margin has also declined over the past five years, as evidenced by the data: 2018: 82.52; 2019: 85.02; 2020: 85.53; 2021: 78.09; 2022: 80.10. This trend underscores the company's struggles to convert its revenue into profits.
Growth Prospects
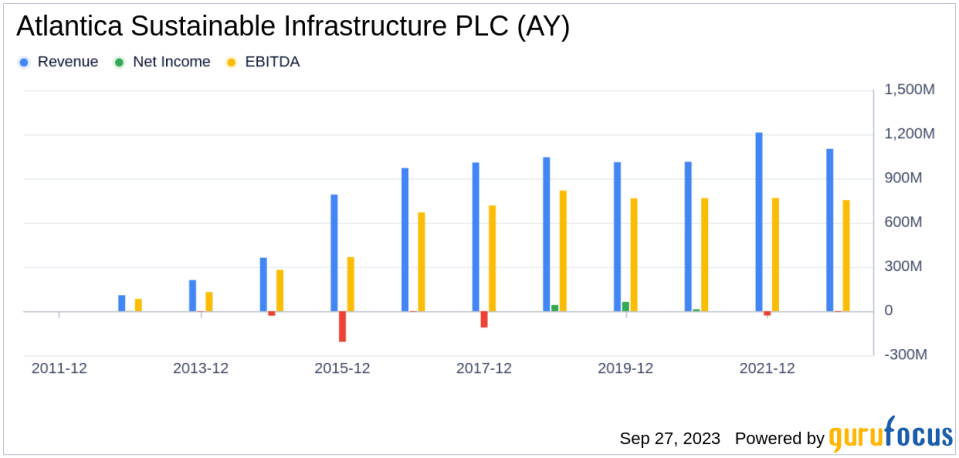
A lack of significant growth is another area where Atlantica Sustainable Infrastructure PLC seems to falter, as evidenced by the company's low Growth rank. The company's revenue has declined by -2.4 per year over the past three years, which underperforms worse than 78.79% of 363 companies in the Utilities - Independent Power Producers industry. Stagnating revenues may pose concerns in a fast-evolving market.
Over the past five years, Atlantica Sustainable Infrastructure PLC has witnessed a decline in its earnings before interest, taxes, depreciation, and amortization (EBITDA). The three-year growth rate is recorded at -5.6, while the five-year growth rate is at -3.4. These figures underscore potential challenges in the company's profitability. Lastly, Atlantica Sustainable Infrastructure PLC predictability rank is just one star out of five, adding to investor uncertainty regarding revenue and earnings consistency.
Conclusion
Given Atlantica Sustainable Infrastructure PLC's financial strength, profitability, and growth metrics, the GF Score highlights the firm's unparalleled position for potential underperformance. While the company has a rich history in the Utilities - Independent Power Producers industry, its recent performance and future prospects raise concerns. Investors should tread carefully and consider these factors when making investment decisions.
GuruFocus Premium members can find more companies with strong GF Scores using the following screener link: GF Score Screen
This article first appeared on GuruFocus.
