Baldwin & Lyons Inc (NASDAQ:BWIN.B): Should The Recent Earnings Drop Worry You?

When Baldwin & Lyons Inc (NASDAQ:BWIN.B) released its most recent earnings update (31 December 2017), I wanted to understand how these figures stacked up against its past performance. The two benchmarks I used were Baldwin & Lyons’s average earnings over the past couple of years, and its industry performance. These are useful yardsticks to help me gauge whether or not BWIN.B actually performed well. Below is a quick commentary on how I see BWIN.B has performed. Check out our latest analysis for Baldwin & Lyons
Was BWIN.B’s weak performance lately a part of a long-term decline?
I prefer to use the ‘latest twelve-month’ data, which either annualizes the most recent 6-month earnings update, or in some cases, the most recent annual report is already the latest available financial data. This blend allows me to analyze different stocks in a uniform manner using the most relevant data points. For Baldwin & Lyons, its latest trailing-twelve-month earnings is US$18.32M, which compared to the prior year’s level, has fallen by a significant -36.70%. Given that these figures may be relatively short-term, I have estimated an annualized five-year value for BWIN.B’s earnings, which stands at US$20.17M This doesn’t look much better, as earnings seem to have consistently been declining over the longer term.
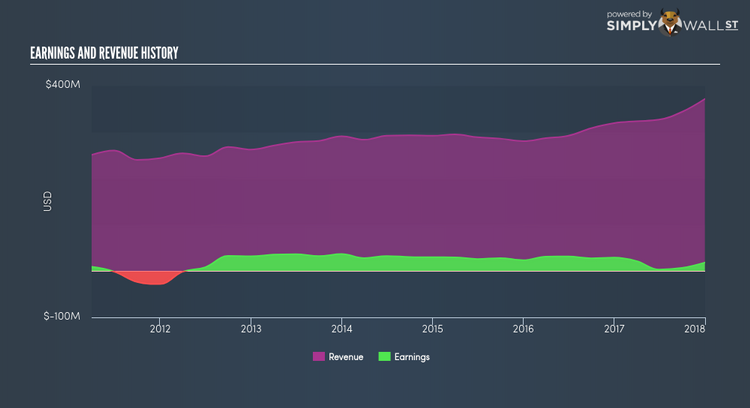
Why could this be happening? Let’s examine what’s going on with margins and if the rest of the industry is experiencing the hit as well. Over the last couple of years, revenue growth has fallen behind which indicates that Baldwin & Lyons’s bottom line has been driven by unsustainable cost-reductions. Looking at growth from a sector-level, the US insurance industry has been growing, albeit, at a subdued single-digit rate of 9.45% in the past year, and 8.42% over the last five years. This means whatever tailwind the industry is benefiting from, Baldwin & Lyons has not been able to realize the gains unlike its average peer.
What does this mean?
Baldwin & Lyons’s track record can be a valuable insight into its earnings performance, but it certainly doesn’t tell the whole story. Generally companies that endure a prolonged period of diminishing earnings are going through some sort of reinvestment phase with the aim of keeping up with the latest industry expansion and disruption. You should continue to research Baldwin & Lyons to get a better picture of the stock by looking at:
1. Financial Health: Is BWIN.B’s operations financially sustainable? Balance sheets can be hard to analyze, which is why we’ve done it for you. Check out our financial health checks here.
2. Valuation: What is BWIN.B worth today? Is the stock undervalued, even when its growth outlook is factored into its intrinsic value? The intrinsic value infographic in our free research report helps visualize whether BWIN.B is currently mispriced by the market.
3. Other High-Performing Stocks: Are there other stocks that provide better prospects with proven track records? Explore our free list of these great stocks here.
NB: Figures in this article are calculated using data from the trailing twelve months from 31 December 2017. This may not be consistent with full year annual report figures.
To help readers see pass the short term volatility of the financial market, we aim to bring you a long-term focused research analysis purely driven by fundamental data. Note that our analysis does not factor in the latest price sensitive company announcements.
The author is an independent contributor and at the time of publication had no position in the stocks mentioned.
