Beat the Market the Zacks Way: Automatic Data Processing, Casey's, Paysafe in Focus
All three widely followed indexes closed a tumultuous week last Friday. The Dow Jones Industrial Average emerged as the only index to finish in the green, advancing only 0.1%, while the S&P 500 and the Nasdaq Composite declined 0.2% and 0.4%, respectively. For the S&P 500 and Nasdaq, it was a second straight week of losses.
Business was driven by the inflation metrics slated for a mid-week release and trying to pre-empt the Fed’s reaction to it. Headline inflation came in high, fueled by increased energy prices, but core inflation remained relatively stable and in line with expectations. The week ended on a downbeat note, with chips stocks plunging, reversing gains made by two of the major indexes earlier in the week. Treasury yields also went up, fueling investor concerns.
For the ensuing week, investors will keep a keen watch on the results of the Fed’s September meeting. However, it is now almost universally expected that the central bank will not raise interest rates this time.
Regardless of market conditions, we, here at Zacks, provide investors with unbiased guidance on how to beat the market.
As usual, Zacks Research guided investors over the past three months with its time-tested methodologies. Given the prevailing market uncertainty, you may want to look at our feats to prepare better for your next action.
Here are some of our key achievements:
Empire State Realty Trust and Iron Mountain Surge Following Zacks Rank Upgrade
Shares of Empire State Realty Trust, Inc. ESRT have gained 12.7% (versus the S&P 500’s 1.5% increase) since it was upgraded to a Zacks Rank #2 (Buy) on July 7.
Another stock, Iron Mountain Incorporated IRM, which was also upgraded to a Zacks Rank #2 on the same date, has returned 7.9% (versus the S&P 500’s 1.5% increase) since then.
Zacks Rank, our short-term rating system, has earnings estimate revisions at its core. Empirical research shows a strong correlation between trends in earnings estimate revisions and near-term stock price movements.
This stock-rating system, which uses four factors related to earnings estimates to classify stocks into five groups, ranging from Zacks Rank #1 (Strong Buy) to Zacks Rank #5 (Strong Sell), has an impressive externally audited track record, with Zacks Rank #1 stocks generating an average annual return of +24.8% since 1988.You can see the complete list of today’s Zacks Rank #1 stocks here >>>
A hypothetical portfolio of Zacks Rank #1 stocks has returned +10.8% this year (through July 3) versus +16.1% for the S&P 500 Index and +7.7% for the equal-weight S&P 500 Index. The set of Zacks Rank #1 stocks is an equal-weight portfolio, while the S&P 500 Index is a market-cap-weighted index that has been notably distorted by the strong recent performance of mega-cap stocks.
We are not trying to cherry-pick here. But since this Zacks Model portfolio, consisting of Zacks Rank # 1 stocks, is an equal-weight portfolio, the equal-weight S&P 500 Index is the appropriate benchmark for comparison.
Check Empire State Realty’s historical EPS and Sales here>>>
Check Iron Mountain’s historical EPS and Sales here>>>
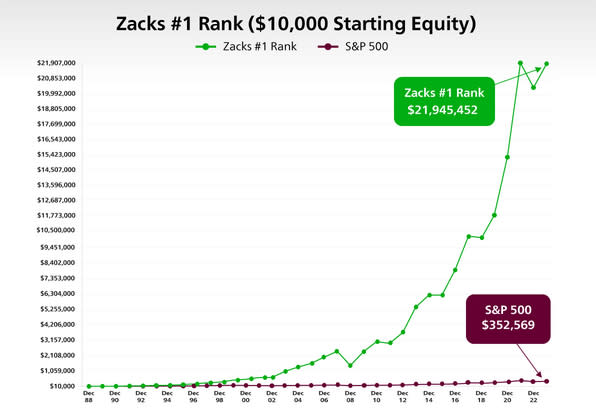
Image Source: Zacks Investment Research
Zacks Recommendation Upgrade Drives Paysafe and Woodward Higher
Shares of Paysafe Limited PSFE andv Woodward, Inc. WWD have advanced 27.4% (versus the S&P 500’s 0.5% rise) and 9.8% (versus the S&P 500’s 1.8% increase) since their Zacks Recommendation was upgraded to Outperform on July 4 and July 10, respectively.
While the Zacks Rank is our short-term rating system that is most effective over the one- to three-month holding horizon, the Zacks Recommendation aims to predict performance over the next 6 to 12 months. However, just like the Zacks Rank, the foundation for the Zacks Recommendation is trends in earnings estimate revisions.
The Zacks Recommendation classifies stocks into three groups — Outperform, Neutral and Underperform. While these recommendations are determined quantitatively, our analysts have the flexibility to override them for the 1100+ stocks they closely follow based on their better judgment of factors such as valuation, industry conditions and management effectiveness than the quantitative model.
To access our research reports with Zacks Recommendations for the 1100+ stocks we cover, click here>>>
Zacks Focus List Stocks Casey's, Celanese Shoot Up
Shares of Casey's General Stores, Inc. CASY, which belongs to the Zacks Focus List, have risen 24.1% over the past 12 weeks. The stock was added to the Focus List on August 20, 2019. Another Focus-List holding, Celanese Corporation CE, which was added to the portfolio on December 5, 2016, has returned 17.2% over the past 12 weeks. The S&P 500 has gained 2.4% over this period.
The Zacks Focus List is a model portfolio of 50 hand-picked stocks that possess the right fundamental ingredients to outperform the market over the next 12 months. These 50 stocks are picked from a long list of stocks with the highest Zacks Rank.
The 50-stock Zacks Focus List model portfolio has returned +17.15% in 2023 (through June 30) versus +16.90% for the S&P 500 Index. In 2022, the portfolio produced -15.2% versus the S&P 500 Index’s -17.96%.
Since 2004, the Focus List portfolio has produced an annualized return of +11.10% through June 30, 2023. This compares to a +9.52% annualized return for the S&P 500 Index in the same period.
On rolling one-, three- and five-year bases, the Zacks Focus List returned +29.36%, +16.74% and +12.45% versus +19.57%, +14.59% and +12.30% for the S&P 500 Index, respectively.
Unlock all of our powerful research, tools and analysis, including the Focus List, Zacks #1 Rank List, Equity Research Reports, Zacks Earnings ESP Filter, Premium Screener and more, as part of Zacks Premium. Gain full access now >>
Zacks ECAP Stocks Novo Nordisk and Intuit Make Significant Gains
Novo Nordisk A/S NVO, a component of our Earnings Certain Admiral Portfolio (ECAP), has jumped 19.7% over the past 12 weeks. Intuit Inc. INTU has followed Novo Nordisk with 18.9% returns.
ECAP, which consists of 30 concentrated, ultra-defensive, long-term Buy and Hold stocks, has returned +6.67% in 2023 (through June 30) versus +16.90% for the S&P 500 Index. The portfolio returned -4.7% in 2022 versus the S&P 500 Index’s -17.96%.
With little to no turnover and annual rebalance periodicity, the ECAP seeks to minimize capital loss by holding shares of companies whose earnings streams exhibit a proven 20+ year track record of surviving recessionary periods with minimal impact on aggregate earnings growth relative to the overall S&P 500.
The ECAP and many other model portfolios are available as part of Zacks Advisor Tools, a cloud-based solution to access Zacks award-winning stock, mutual fund and ETF research. Click here to schedule a demo.
Zacks ECDP Stocks Amgen and Automatic Data Processing Outperform Peers
Amgen Inc. AMGN, which is part of our Earnings Certain Dividend Portfolio (ECDP), has returned 14.8% over the past 12 weeks. Another ECDP stock, Automatic Data Processing, Inc. ADP, has climbed 14.7% over the same time frame. Of course, the inclination of investors toward quality dividend stocks to secure an income stream amid heightened market volatility contributed to this performance.
Check Amgen’s dividend history here>>>
Check Automatic Data Processing’s dividend history here>>>
With an extremely low Beta and a history of minimum earnings variability over the last 20+ years, this 25-stock portfolio helps significantly mitigate risk.
ECDP has returned +0.18% in 2023 (through June 30) versus +16.90% for the S&P 500 Index. The portfolio returned -2.3% in 2022 versus -17.96% for the S&P 500 Index and -8.34% for the ProShares S&P 500 Dividend Aristocrats ETF NOBL.
Click here to access this portfolio on Zacks Advisor Tools.
Zacks Top 10 Stocks — Hubbell Delivers Solid Returns
Hubbell Incorporated HUBB, from the Zacks Top 10 Stocks for 2023, has gained 34.6% year to date compared with a 17.1% rise for the S&P 500 Index.
The portfolio returned +15.9% through the end of June 2023 versus +16.9% for the S&P 500 (the equal-weighted index, a more appropriate benchmark, returned +7% in the same period). The portfolio returned -15.8% in 2022 versus -18.1% for the S&P 500 Index. Since 2012, the Top 10 portfolio has generated an annualized return of +22.4% versus +12.5% for the S&P 500 Index.
Since the start of 2012 through May 31, 2023, the Zacks Top 10 Stocks produced a cumulative return of +827.6% through the end of 2022 vs. +265% cumulative return for the S&P 500 index.
Want the latest recommendations from Zacks Investment Research? Today, you can download 7 Best Stocks for the Next 30 Days. Click to get this free report
Automatic Data Processing, Inc. (ADP) : Free Stock Analysis Report
Iron Mountain Incorporated (IRM) : Free Stock Analysis Report
Novo Nordisk A/S (NVO) : Free Stock Analysis Report
Amgen Inc. (AMGN) : Free Stock Analysis Report
Intuit Inc. (INTU) : Free Stock Analysis Report
Celanese Corporation (CE) : Free Stock Analysis Report
Casey's General Stores, Inc. (CASY) : Free Stock Analysis Report
Woodward, Inc. (WWD) : Free Stock Analysis Report
Empire State Realty Trust, Inc. (ESRT) : Free Stock Analysis Report
Hubbell Inc (HUBB) : Free Stock Analysis Report
ProShares S&P 500 Dividend Aristocrats ETF (NOBL): ETF Research Reports
Paysafe Limited (PSFE) : Free Stock Analysis Report
