Beazley plc's (LON:BEZ) Fundamentals Look Pretty Strong: Could The Market Be Wrong About The Stock?
Beazley (LON:BEZ) has had a rough three months with its share price down 12%. However, the company's fundamentals look pretty decent, and long-term financials are usually aligned with future market price movements. In this article, we decided to focus on Beazley's ROE.
Return on equity or ROE is an important factor to be considered by a shareholder because it tells them how effectively their capital is being reinvested. Simply put, it is used to assess the profitability of a company in relation to its equity capital.
Check out our latest analysis for Beazley
How Do You Calculate Return On Equity?
ROE can be calculated by using the formula:
Return on Equity = Net Profit (from continuing operations) ÷ Shareholders' Equity
So, based on the above formula, the ROE for Beazley is:
6.2% = US$161m ÷ US$2.6b (Based on the trailing twelve months to December 2022).
The 'return' is the income the business earned over the last year. So, this means that for every £1 of its shareholder's investments, the company generates a profit of £0.06.
What Has ROE Got To Do With Earnings Growth?
Thus far, we have learned that ROE measures how efficiently a company is generating its profits. We now need to evaluate how much profit the company reinvests or "retains" for future growth which then gives us an idea about the growth potential of the company. Generally speaking, other things being equal, firms with a high return on equity and profit retention, have a higher growth rate than firms that don’t share these attributes.
Beazley's Earnings Growth And 6.2% ROE
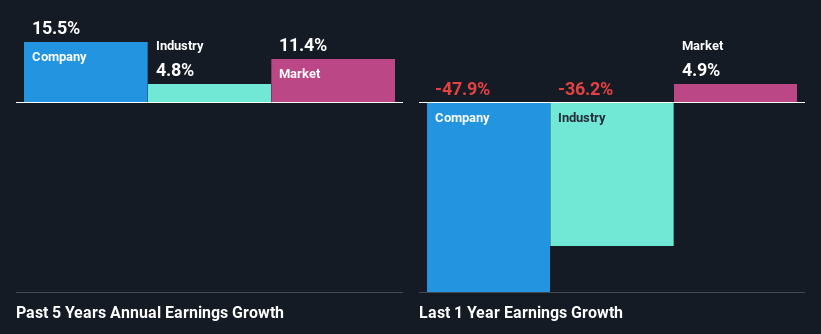
On the face of it, Beazley's ROE is not much to talk about. However, given that the company's ROE is similar to the average industry ROE of 7.7%, we may spare it some thought. Having said that, Beazley has shown a modest net income growth of 16% over the past five years. Given the slightly low ROE, it is likely that there could be some other aspects that are driving this growth. Such as - high earnings retention or an efficient management in place.
We then compared Beazley's net income growth with the industry and we're pleased to see that the company's growth figure is higher when compared with the industry which has a growth rate of 4.8% in the same 5-year period.
Earnings growth is a huge factor in stock valuation. What investors need to determine next is if the expected earnings growth, or the lack of it, is already built into the share price. Doing so will help them establish if the stock's future looks promising or ominous. One good indicator of expected earnings growth is the P/E ratio which determines the price the market is willing to pay for a stock based on its earnings prospects. So, you may want to check if Beazley is trading on a high P/E or a low P/E, relative to its industry.
Is Beazley Making Efficient Use Of Its Profits?
While Beazley has a three-year median payout ratio of 58% (which means it retains 42% of profits), the company has still seen a fair bit of earnings growth in the past, meaning that its high payout ratio hasn't hampered its ability to grow.
Moreover, Beazley is determined to keep sharing its profits with shareholders which we infer from its long history of paying a dividend for at least ten years. Our latest analyst data shows that the future payout ratio of the company is expected to drop to 15% over the next three years. As a result, the expected drop in Beazley's payout ratio explains the anticipated rise in the company's future ROE to 24%, over the same period.
Summary
In total, it does look like Beazley has some positive aspects to its business. While no doubt its earnings growth is pretty substantial, we do feel that the reinvestment rate is pretty low, meaning, the earnings growth number could have been significantly higher had the company been retaining more of its profits. That being so, the latest analyst forecasts show that the company will continue to see an expansion in its earnings. To know more about the latest analysts predictions for the company, check out this visualization of analyst forecasts for the company.
Have feedback on this article? Concerned about the content? Get in touch with us directly. Alternatively, email editorial-team (at) simplywallst.com.
This article by Simply Wall St is general in nature. We provide commentary based on historical data and analyst forecasts only using an unbiased methodology and our articles are not intended to be financial advice. It does not constitute a recommendation to buy or sell any stock, and does not take account of your objectives, or your financial situation. We aim to bring you long-term focused analysis driven by fundamental data. Note that our analysis may not factor in the latest price-sensitive company announcements or qualitative material. Simply Wall St has no position in any stocks mentioned.
