What is Behind Halma plc’s (LON:HLMA) Superior ROE?

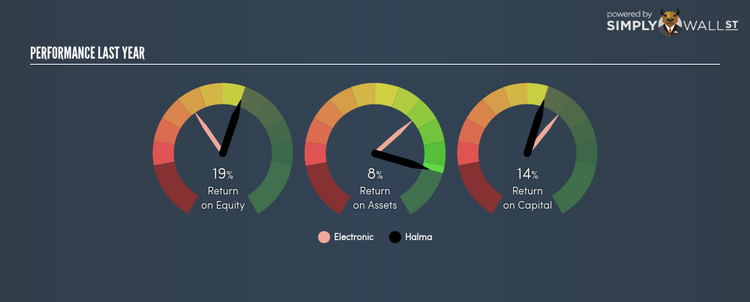
With an ROE of 18.99%, Halma plc (LSE:HLMA) outpaced its own industry which delivered a less exciting 10.49% over the past year. On the surface, this looks fantastic since we know that HLMA has made large profits from little equity capital; however, ROE doesn’t tell us if management have borrowed heavily to make this happen. In this article, we’ll closely examine some factors like financial leverage to evaluate the sustainability of HLMA’s ROE. View our latest analysis for Halma
What you must know about ROE
Firstly, Return on Equity, or ROE, is simply the percentage of last years’ earning against the book value of shareholders’ equity. For example, if the company invests £1 in the form of equity, it will generate £0.19 in earnings from this. In most cases, a higher ROE is preferred; however, there are many other factors we must consider prior to making any investment decisions.
Return on Equity = Net Profit ÷ Shareholders Equity
ROE is assessed against cost of equity, which is measured using the Capital Asset Pricing Model (CAPM) – but let’s not dive into the details of that today. For now, let’s just look at the cost of equity number for Halma, which is 8.30%. This means Halma returns enough to cover its own cost of equity, with a buffer of 10.69%. This sustainable practice implies that the company pays less for its capital than what it generates in return. ROE can be dissected into three distinct ratios: net profit margin, asset turnover, and financial leverage. This is called the Dupont Formula:
Dupont Formula
ROE = profit margin × asset turnover × financial leverage
ROE = (annual net profit ÷ sales) × (sales ÷ assets) × (assets ÷ shareholders’ equity)
ROE = annual net profit ÷ shareholders’ equity
Basically, profit margin measures how much of revenue trickles down into earnings which illustrates how efficient the business is with its cost management. Asset turnover reveals how much revenue can be generated from Halma’s asset base. The most interesting ratio, and reflective of sustainability of its ROE, is financial leverage. Since ROE can be artificially increased through excessive borrowing, we should check Halma’s historic debt-to-equity ratio. Currently the debt-to-equity ratio stands at a low 32.59%, which means its above-average ROE is driven by its ability to grow its profit without a significant debt burden.

Next Steps:
While ROE is a relatively simple calculation, it can be broken down into different ratios, each telling a different story about the strengths and weaknesses of a company. Halma’s ROE is impressive relative to the industry average and also covers its cost of equity. Its high ROE is not likely to be driven by high debt. Therefore, investors may have more confidence in the sustainability of this level of returns going forward. Although ROE can be a useful metric, it is only a small part of diligent research.
For Halma, I’ve put together three essential aspects you should further examine:
1. Financial Health: Does it have a healthy balance sheet? Take a look at our free balance sheet analysis with six simple checks on key factors like leverage and risk.
2. Valuation: What is Halma worth today? Is the stock undervalued, even when its growth outlook is factored into its intrinsic value? The intrinsic value infographic in our free research report helps visualize whether Halma is currently mispriced by the market.
3. Other High-Growth Alternatives : Are there other high-growth stocks you could be holding instead of Halma? Explore our interactive list of stocks with large growth potential to get an idea of what else is out there you may be missing!
To help readers see pass the short term volatility of the financial market, we aim to bring you a long-term focused research analysis purely driven by fundamental data. Note that our analysis does not factor in the latest price sensitive company announcements.
The author is an independent contributor and at the time of publication had no position in the stocks mentioned.
