What is Behind Zoetis Inc’s (ZTS) Superior ROE?

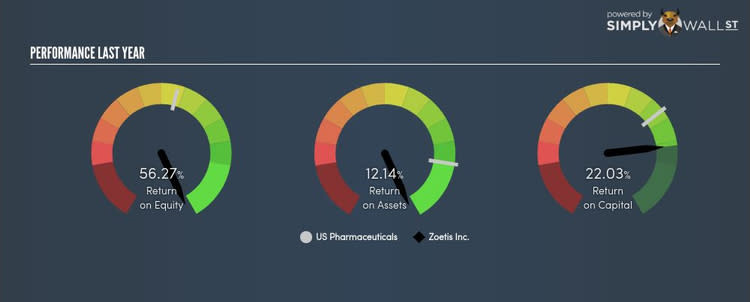
Zoetis Inc (NYSE:ZTS) delivered an ROE of 56.27% over the past 12 months, which is an impressive feat relative to its industry average of 18.27% during the same period. While the impressive ratio tells us that ZTS has made significant profits from little equity capital, ROE doesn’t tell us if ZTS has borrowed debt to make this happen. In this article, we’ll closely examine some factors like financial leverage to evaluate the sustainability of ZTS’s ROE. Check out our latest analysis for Zoetis
Breaking down Return on Equity
Return on Equity (ROE) is a measure of ZTS’s profit relative to its shareholders’ equity. It essentially shows how much ZTS can generate in earnings given the amount of equity it has raised. While a higher ROE is preferred in most cases, there are several other factors we should consider before drawing any conclusions.
Return on Equity = Net Profit ÷ Shareholders Equity
Returns are usually compared to costs to measure the efficiency of capital. ZTS’s cost of equity is 8.49%. Given a positive discrepancy of 47.78% between return and cost, this indicates that ZTS pays less for its capital than what it generates in return, which is a sign of capital efficiency. ROE can be broken down into three different ratios: net profit margin, asset turnover, and financial leverage. This is called the Dupont Formula:
Dupont Formula
ROE = profit margin × asset turnover × financial leverage
ROE = (annual net profit ÷ sales) × (sales ÷ assets) × (assets ÷ shareholders’ equity)
ROE = annual net profit ÷ shareholders’ equity
Essentially, profit margin shows how much money the company makes after paying for all its expenses. Asset turnover reveals how much revenue can be generated from ZTS’s asset base. The most interesting ratio, and reflective of sustainability of its ROE, is financial leverage. Since ROE can be inflated by excessive debt, we need to examine ZTS’s debt-to-equity level. The debt-to-equity ratio currently stands at over 2.5 times, meaning the above-average ratio is a result of a large amount of debt.

What this means for you:
Are you a shareholder? ZTS’s ROE is impressive relative to the industry average and also covers its cost of equity. However, with debt capital in excess of equity, ROE might be inflated by the use of debt funding, which is something you should be aware of before buying more ZTS shares.
Are you a potential investor? If ZTS has been on your watch list for a while, making an investment decision based on ROE alone is unwise. I recommend you do additional fundamental analysis by looking through our most recent infographic report on Zoetis to help you make a more informed investment decision. If you are not interested in ZTS anymore, you can use our free platform to see our list of stocks with Return on Equity over 20%.
To help readers see pass the short term volatility of the financial market, we aim to bring you a long-term focused research analysis purely driven by fundamental data. Note that our analysis does not factor in the latest price sensitive company announcements.
The author is an independent contributor and at the time of publication had no position in the stocks mentioned.
