What Is Berry Global Group's (NYSE:BERY) P/E Ratio After Its Share Price Rocketed?

Berry Global Group (NYSE:BERY) shareholders are no doubt pleased to see that the share price has bounced 33% in the last month alone, although it is still down 16% over the last quarter. But shareholders may not all be feeling jubilant, since the share price is still down 36% in the last year.
All else being equal, a sharp share price increase should make a stock less attractive to potential investors. In the long term, share prices tend to follow earnings per share, but in the short term prices bounce around in response to short term factors (which are not always obvious). So some would prefer to hold off buying when there is a lot of optimism towards a stock. One way to gauge market expectations of a stock is to look at its Price to Earnings Ratio (PE Ratio). Investors have optimistic expectations of companies with higher P/E ratios, compared to companies with lower P/E ratios.
Check out our latest analysis for Berry Global Group
How Does Berry Global Group's P/E Ratio Compare To Its Peers?
We can tell from its P/E ratio of 13.60 that sentiment around Berry Global Group isn't particularly high. We can see in the image below that the average P/E (16.5) for companies in the packaging industry is higher than Berry Global Group's P/E.
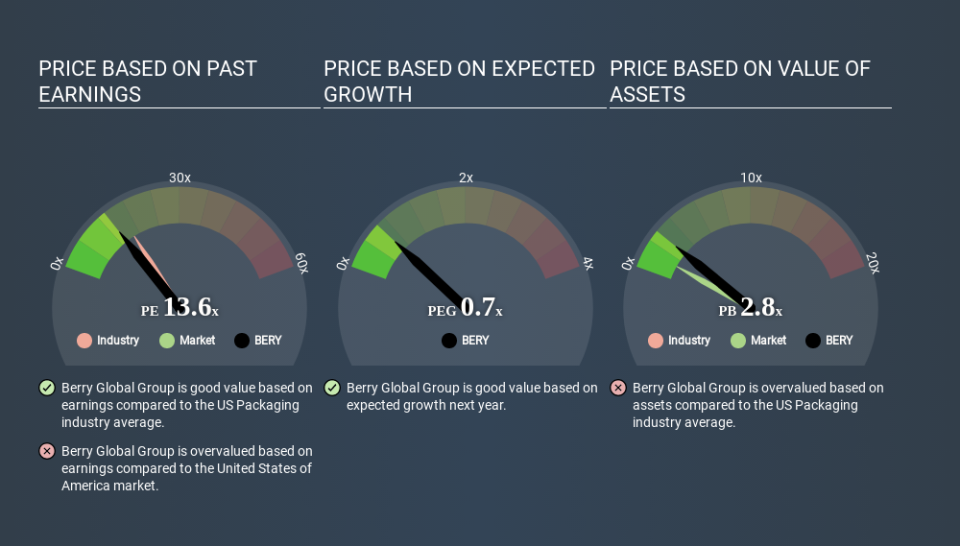
This suggests that market participants think Berry Global Group will underperform other companies in its industry. Many investors like to buy stocks when the market is pessimistic about their prospects. It is arguably worth checking if insiders are buying shares, because that might imply they believe the stock is undervalued.
How Growth Rates Impact P/E Ratios
P/E ratios primarily reflect market expectations around earnings growth rates. If earnings are growing quickly, then the 'E' in the equation will increase faster than it would otherwise. Therefore, even if you pay a high multiple of earnings now, that multiple will become lower in the future. And as that P/E ratio drops, the company will look cheap, unless its share price increases.
Berry Global Group saw earnings per share decrease by 14% last year. But EPS is up 36% over the last 5 years.
A Limitation: P/E Ratios Ignore Debt and Cash In The Bank
The 'Price' in P/E reflects the market capitalization of the company. So it won't reflect the advantage of cash, or disadvantage of debt. Hypothetically, a company could reduce its future P/E ratio by spending its cash (or taking on debt) to achieve higher earnings.
Spending on growth might be good or bad a few years later, but the point is that the P/E ratio does not account for the option (or lack thereof).
So What Does Berry Global Group's Balance Sheet Tell Us?
Berry Global Group has net debt worth a very significant 213% of its market capitalization. This level of debt justifies a relatively low P/E, so remain cognizant of the debt, if you're comparing it to other stocks.
The Verdict On Berry Global Group's P/E Ratio
Berry Global Group's P/E is 13.6 which is about average (14.0) in the US market. With relatively high debt, and no earnings per share growth over twelve months, the P/E suggests that many have an expectation that company will find some growth. What is very clear is that the market has become more optimistic about Berry Global Group over the last month, with the P/E ratio rising from 10.2 back then to 13.6 today. For those who prefer to invest with the flow of momentum, that might mean it's time to put the stock on a watchlist, or research it. But the contrarian may see it as a missed opportunity.
Investors should be looking to buy stocks that the market is wrong about. If the reality for a company is not as bad as the P/E ratio indicates, then the share price should increase as the market realizes this. So this free report on the analyst consensus forecasts could help you make a master move on this stock.
Of course, you might find a fantastic investment by looking at a few good candidates. So take a peek at this free list of companies with modest (or no) debt, trading on a P/E below 20.
If you spot an error that warrants correction, please contact the editor at editorial-team@simplywallst.com. This article by Simply Wall St is general in nature. It does not constitute a recommendation to buy or sell any stock, and does not take account of your objectives, or your financial situation. Simply Wall St has no position in the stocks mentioned.
We aim to bring you long-term focused research analysis driven by fundamental data. Note that our analysis may not factor in the latest price-sensitive company announcements or qualitative material. Thank you for reading.
