Best Buy (BBY) Q2 Earnings Beat, Comparable Sales Dip 6.2% Y/Y
Best Buy Co., Inc. BBY has posted better-than-expected earnings for second-quarter fiscal 2024. However, sales and earnings decreased year over year. Best Buy’s adjusted earnings of $1.22 per share beat the Zacks Consensus Estimate of earnings of $1.06. The bottom line decreased from the $1.54 per share recorded in the year-ago period.
Over the past three months, this presently Zacks Rank #2 (Buy) stock has gained 0.9% against the industry’s 8.5% decline.
Q2 Details
Enterprise revenues declined 7.2% from the prior fiscal year’s quarterly number to $9,583 million. The figure surpassed the Zacks Consensus Estimate of $9,521 million. Enterprise comparable sales dropped 6.2% year over year, narrower than the 12.1% decline seen in the year-ago quarter.
Gross profit declined 2.9% to $2,220 million, while the gross margin expanded 110 basis points (bps) to 23.2%. The metric fared better than our estimate of 22.8%. Adjusted operating income came in at $362 million, down from the $427 million recorded in the year-ago quarter. The adjusted operating margin shrank 30 bps to 3.8% but fared better than our estimate of 3.2%.
We note that adjusted selling, general and administrative expenses fell 0.1% to $1,858 million, while as a percentage of revenues, the same increased 140 bps to 19.4%. Our estimate for adjusted SG&A expenses, as a rate of revenues, was pegged at 19.7%.
Best Buy Co., Inc. Price, Consensus and EPS Surprise
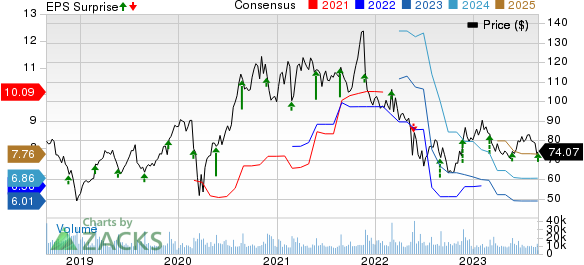
Best Buy Co., Inc. price-consensus-eps-surprise-chart | Best Buy Co., Inc. Quote
Segmental Details
The Domestic segment’s revenues fell 7.1% to $8,890 million. This decline from the last fiscal year’s quarterly reading was mainly induced by a comparable sales decrease of 6.3%. From a merchandising perspective, comparable sales decreased in categories, with the major drivers being appliances, home theater, computing and mobile phones, partially offset by growth in gaming. We expected revenues of $8,744.3 million from this segment in the quarter.
The Domestic segment’s online revenues of $2.76 billion declined 7.1% year over year on a comparable basis. As a percentage of total domestic revenues, online revenues were 31%, flat year over year.
The segment’s gross profit rate increased 110 bps to 23.1% due to better performance from the company’s membership offerings, including higher service margin rates and lower costs; favorable product margin rates; and higher gross profit rate from the company’s Health initiatives.
In the International segment, revenues fell 8.8% to $693 million mainly due to a comparable sales decline of 5.4% and adverse foreign currency translations of 340 bps. The segment’s operating income came in at $19 million or 2.7% of revenues, lower than the $28 million or 3.7% of revenues reported in the year-ago quarter. Our estimate for revenues from the segment was pegged at $717.4 million.
Other Details
Best Buy ended the quarter with cash and cash equivalents of $1,093 million, long-term debt of $1,145 million and a total equity of $2,835 million.
At the end of the reported quarter, merchandise inventories of $5,651 million decreased 6.5% from the year-ago quarter’s reading.
In the quarter, BBY returned about $279 million to its shareholders via dividends of $200 million and share repurchases of $79 million. The company’s board has announced the payment of a regular quarterly cash dividend of 92 cents per share, payable Oct 10, 2023, to shareholders of record as of Sep 19, 2023.
Guidance
For fiscal 2024, including 53 weeks, management projects revenues of $43.8-$44.5 billion and a comparable sales decline of 4.5-6%. Earlier, it anticipated revenues of $43.8-$45.2 billion, with a comparable sales decline of 3-6%.
The company expects a fiscal 2024 adjusted operating margin of 3.9-4.1% compared with the 3.7-4.1% mentioned earlier. For fiscal 2024, management anticipates an effective income tax rate of 24.5%. For fiscal 2024, the company expects adjusted earnings per share (EPS) between $6.00 and $6.40 compared with the $5.70 and $6.50 guided earlier. Capital expenditure is anticipated to be $850 million.
Other Stocks to Consider
We have highlighted three other top-ranked stocks, namely Abercrombie & Fitch ANF, Boot Barn BOOT and American Eagle Outfitters AEO.
Abercrombie & Fitch, a leading casual apparel retailer, currently sports a Zacks Rank #1 (Strong Buy). You can see the complete list of today’s Zacks #1 Rank stocks here.
The Zacks Consensus Estimate for Abercrombie & Fitch’s current financial-year sales and earnings per share (EPS) suggests growth of 10.1% and 1,372%, respectively, from the year-ago reported figures. ANF has delivered an earnings surprise of 724.8% in the last four quarters, on average.
Boot Barn, a fashion retailer of apparel and accessories, currently sports a Zacks Rank #1. The company has a trailing four-quarter earnings surprise of 13.5%, on average.
The Zacks Consensus Estimate for Boot Barn’s current financial-year sales suggests growth of 5.1% from the year-ago reported figure.
American Eagle Outfitters, a retailer of casual apparel, accessories and footwear, currently carries a Zacks Rank #2. AEO has delivered an average earnings surprise of 9.2% in the last four quarters.
The Zacks Consensus Estimate for American Eagle Outfitters’ current financial-year EPS suggests growth of 8.3% from the year-ago reported figure.
Want the latest recommendations from Zacks Investment Research? Today, you can download 7 Best Stocks for the Next 30 Days. Click to get this free report
Abercrombie & Fitch Company (ANF) : Free Stock Analysis Report
American Eagle Outfitters, Inc. (AEO) : Free Stock Analysis Report
Best Buy Co., Inc. (BBY) : Free Stock Analysis Report
Boot Barn Holdings, Inc. (BOOT) : Free Stock Analysis Report
