Best Buy Co Inc's Dividend Analysis
Assessing the Upcoming Dividend and Financial Health of Best Buy Co Inc
Best Buy Co Inc (NYSE:BBY) recently announced a dividend of $0.94 per share, payable on 2024-04-11, with the ex-dividend date set for 2024-03-20. As investors look forward to this upcoming payment, the spotlight also shines on the company's dividend history, yield, and growth rates. Using the data from GuruFocus, let's look into Best Buy Co Inc's dividend performance and assess its sustainability.
What Does Best Buy Co Inc Do?
This Powerful Chart Made Peter Lynch 29% A Year For 13 Years
How to calculate the intrinsic value of a stock?
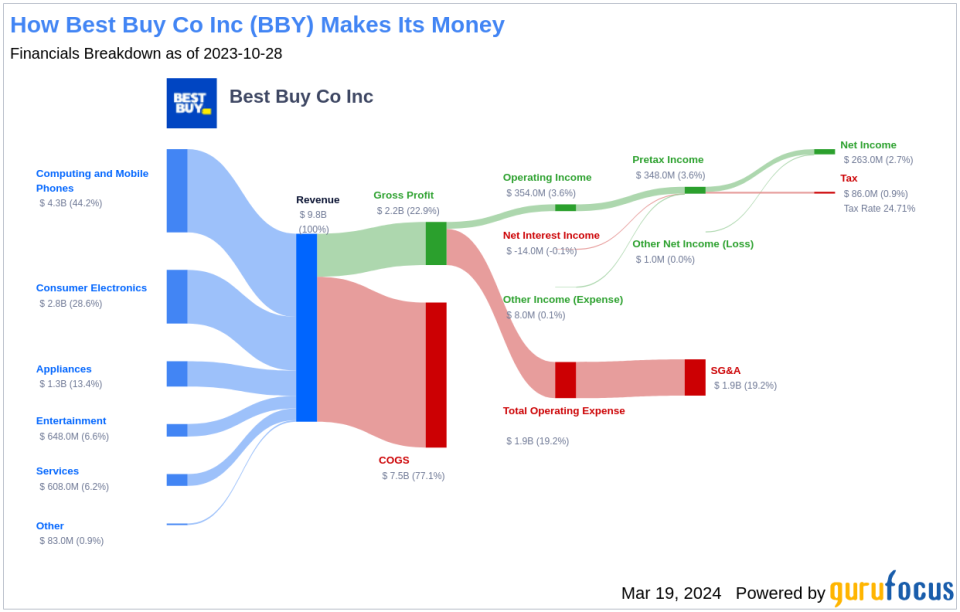
With $43.5 billion in consolidated 2023 sales, Best Buy is the largest pure-play consumer electronics retailer in the U.S., boasting roughly 8.3% share of the North American market and north of 33% share of offline sales in the region, per our calculations, CTA, and Euromonitor data. The firm generates the bulk of its sales in-store, with mobile phones and tablets, computers, and appliances representing its three largest categories. Recent investments in e-commerce fulfillment, accelerated by the COVID-19 pandemic, have seen the U.S. e-commerce channel roughly double from prepandemic levels, with management estimating that it will represent a mid-30% proportion of sales moving forward.
A Glimpse at Best Buy Co Inc's Dividend History
Best Buy Co Inc has maintained a consistent dividend payment record since 2003. Dividends are currently distributed on a quarterly basis. Best Buy Co Inc has increased its dividend each year since 2014. The stock is thus listed as a dividend achiever, an honor that is given to companies that have increased their dividend each year for at least the past 10 years.
Below is a chart showing annual Dividends Per Share for tracking historical trends.
Breaking Down Best Buy Co Inc's Dividend Yield and Growth
As of today, Best Buy Co Inc currently has a 12-month trailing dividend yield of 4.78% and a 12-month forward dividend yield of 4.88%. This suggests an expectation of increased dividend payments over the next 12 months.
Over the past three years, Best Buy Co Inc's annual dividend growth rate was 18.70%. Extended to a five-year horizon, this rate decreased to 17.10% per year. And over the past decade, Best Buy Co Inc's annual dividends per share growth rate stands at an impressive 19.80%.
Based on Best Buy Co Inc's dividend yield and five-year growth rate, the 5-year yield on cost of Best Buy Co Inc stock as of today is approximately 10.52%.

The Sustainability Question: Payout Ratio and Profitability
To assess the sustainability of the dividend, one needs to evaluate the company's payout ratio. The dividend payout ratio provides insights into the portion of earnings the company distributes as dividends. A lower ratio suggests that the company retains a significant part of its earnings, thereby ensuring the availability of funds for future growth and unexpected downturns. As of 2024-01-31, Best Buy Co Inc's dividend payout ratio is 0.58.
Best Buy Co Inc's profitability rank, offers an understanding of the company's earnings prowess relative to its peers. GuruFocus ranks Best Buy Co Inc's profitability 9 out of 10 as of 2024-01-31, suggesting good profitability prospects. The company has reported positive net income for each of year over the past decade, further solidifying its high profitability.
Growth Metrics: The Future Outlook
To ensure the sustainability of dividends, a company must have robust growth metrics. Best Buy Co Inc's growth rank of 9 out of 10 suggests that the company's growth trajectory is good relative to its competitors.
Revenue is the lifeblood of any company, and Best Buy Co Inc's revenue per share, combined with the 3-year revenue growth rate, indicates a strong revenue model. Best Buy Co Inc's revenue has increased by approximately 3.40% per year on average, a rate that underperforms than approximately 54.1% of global competitors.
The company's 3-year EPS growth rate showcases its capability to grow its earnings, a critical component for sustaining dividends in the long run. During the past three years, Best Buy Co Inc's earnings increased by approximately -7.00% per year on average, a rate that underperforms than approximately 71.62% of global competitors.
Lastly, the company's 5-year EBITDA growth rate of 4.70%, which underperforms than approximately 60.43% of global competitors.
Concluding Insights on Best Buy Co Inc's Dividend Prowess
In conclusion, Best Buy Co Inc's upcoming dividend payment reflects the company's commitment to delivering shareholder value through consistent dividend growth. The dividend achiever status, coupled with a moderate payout ratio and high profitability rank, suggests that Best Buy Co Inc is in a strong position to maintain its dividend payments. While the growth metrics present a mixed picture, with revenue growth lagging behind some global competitors, the company's significant market share and e-commerce expansion provide a solid foundation for future growth. Investors should monitor these factors closely as they consider the long-term prospects of their investment in Best Buy Co Inc.
GuruFocus Premium users can screen for high-dividend yield stocks using the High Dividend Yield Screener.
This article, generated by GuruFocus, is designed to provide general insights and is not tailored financial advice. Our commentary is rooted in historical data and analyst projections, utilizing an impartial methodology, and is not intended to serve as specific investment guidance. It does not formulate a recommendation to purchase or divest any stock and does not consider individual investment objectives or financial circumstances. Our objective is to deliver long-term, fundamental data-driven analysis. Be aware that our analysis might not incorporate the most recent, price-sensitive company announcements or qualitative information. GuruFocus holds no position in the stocks mentioned herein.
This article first appeared on GuruFocus.
