Is Bilibili (BILI) Too Good to Be True? A Comprehensive Analysis of a Potential Value Trap
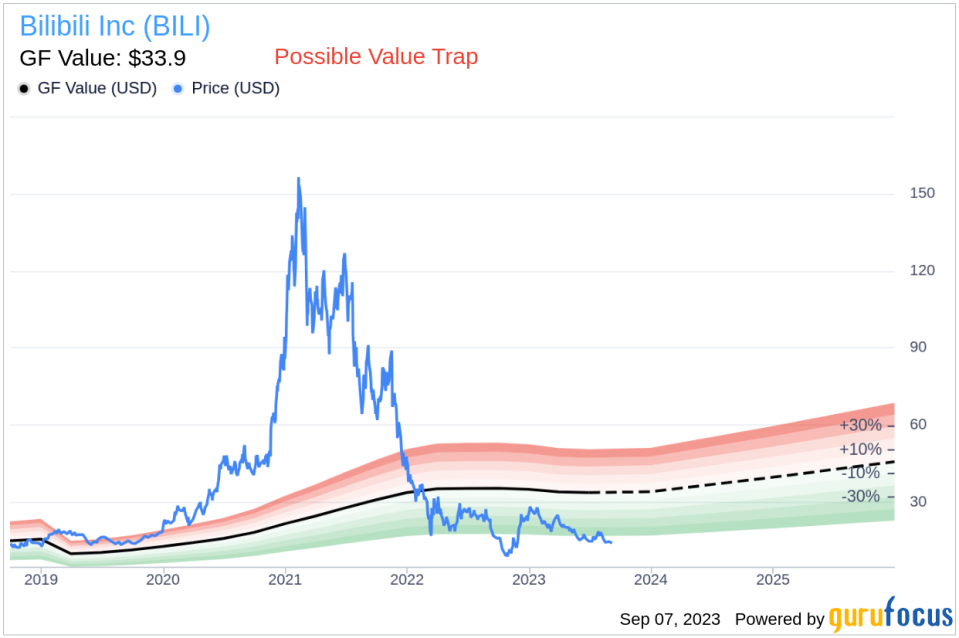
Value-focused investors are always on the hunt for stocks that are priced below their intrinsic value. One such stock that merits attention is Bilibili (NASDAQ:BILI). The stock, which is currently priced at 14.13, recorded a loss of 7.89% in a day and a 3-month decrease of 9.16%. The stock's fair valuation is $33.9, as indicated by its GF Value.
Understanding the GF Value
The GF Value represents the current intrinsic value of a stock derived from our exclusive method. The GF Value Line on our summary page gives an overview of the fair value that the stock should be traded at. It is calculated based on three factors:
1. Historical multiples (PE Ratio, PS Ratio, PB Ratio and Price-to-Free-Cash-Flow) that the stock has traded at.
2. GuruFocus adjustment factor based on the company's past returns and growth.
3. Future estimates of the business performance.
Scrutinizing Bilibili's Financial Health
However, investors need to consider a more in-depth analysis before making an investment decision. Despite its seemingly attractive valuation, certain risk factors associated with Bilibili should not be ignored. These risks are primarily reflected through its low Altman Z-score of 0.83. These indicators suggest that Bilibili, despite its apparent undervaluation, might be a potential value trap. This complexity underlines the importance of thorough due diligence in investment decision-making.
Decoding the Altman Z-Score
Before delving into the details, let's understand what the Altman Z-score entails. Invented by New York University Professor Edward I. Altman in 1968, the Z-Score is a financial model that predicts the probability of a company entering bankruptcy within a two-year time frame. The Altman Z-Score combines five different financial ratios, each weighted to create a final score. A score below 1.8 suggests a high likelihood of financial distress, while a score above 3 indicates a low risk.
Exploring Bilibili's Business Model
Bilibili is a Chinese online entertainment platform that is best known for its video-sharing site that resembles YouTube. The site was founded in 2009 and started as a long-form video platform for anime, comics, and gaming, or ACG, content that appealed to Gen Z users. Since then, it has expanded its content on the platform to include a broader range of interests that have attracted Chinese users outside of the Gen Z cohort. The firm generates revenue through five main areas: advertising, games, live streaming, value-added services, and e-commerce.
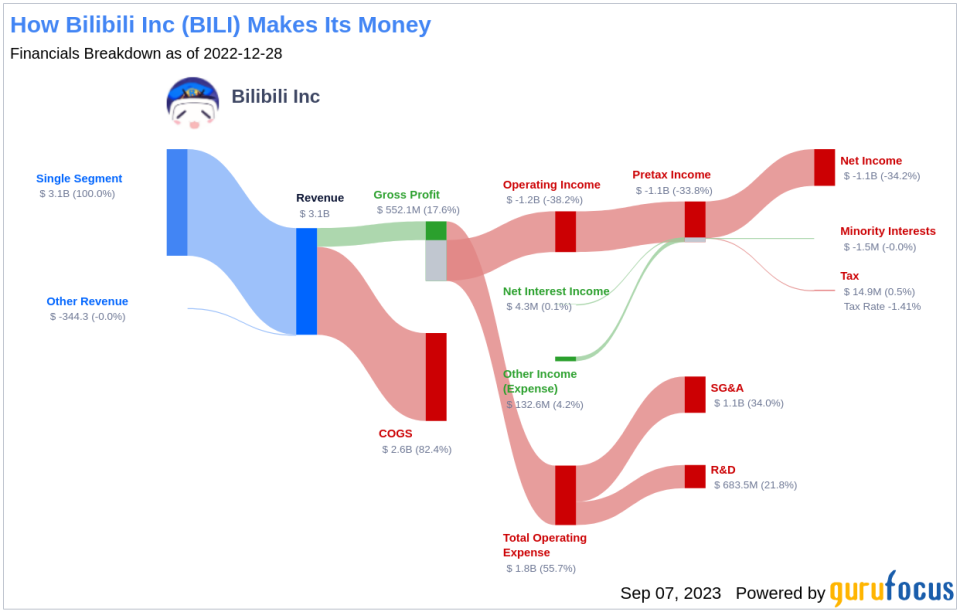
Assessing Bilibili's Financial Performance
A dissection of Bilibili's Altman Z-score reveals Bilibili's financial health may be weak, suggesting possible financial distress. The EBIT to Total Assets ratio serves as a crucial barometer of a company's operational effectiveness, correlating earnings before interest and taxes (EBIT) to total assets. An analysis of Bilibili's EBIT to Total Assets ratio from historical data (2021: -0.09; 2022: -0.19; 2023: -0.15) indicates a descending trend. This reduction suggests that Bilibili might not be utilizing its assets to their full potential to generate operational profits, which could be negatively affecting the company's overall Z-score.
When it comes to operational efficiency, a vital indicator for Bilibili is its asset turnover. The data: 2021: 0.50; 2022: 0.45; 2023: 0.52 from the past three years suggests a recent decline following an initial increase in this ratio. The asset turnover ratio reflects how effectively a company is using its assets to generate sales. Therefore, a drop in this ratio can signify reduced operational efficiency, potentially due to underutilization of assets or decreased market demand for the company's products or services. This shift in Bilibili's asset turnover underlines the need for the company to reassess its operational strategies to optimize asset usage and boost sales.
Conclusion: Navigating the Bilibili Dilemma
Despite its seemingly attractive valuation, Bilibili's low Altman Z-score, declining EBIT to Total Assets ratio, and inconsistent asset turnover ratio suggest that it might be a potential value trap. Investors should approach with caution and conduct thorough due diligence before making any investment decisions.
GuruFocus Premium members can find stocks with high Altman Z-Score using the following Screener: Walter Schloss Screen .
This article first appeared on GuruFocus.
