Bionomics (ASX:BNO) adds AU$20m to market cap in the past 7 days, though investors from five years ago are still down 84%
Bionomics Limited (ASX:BNO) shareholders should be happy to see the share price up 29% in the last week. But spare a thought for the long term holders, who have held the stock as it bled value over the last five years. Five years have seen the share price descend precipitously, down a full 86%. While the recent increase might be a green shoot, we're certainly hesitant to rejoice. The real question is whether the business can leave its past behind and improve itself over the years ahead. We really feel for shareholders in this scenario. It's a good reminder of the importance of diversification, and it's worth keeping in mind there's more to life than money, anyway.
On a more encouraging note the company has added AU$20m to its market cap in just the last 7 days, so let's see if we can determine what's driven the five-year loss for shareholders.
View our latest analysis for Bionomics
Given that Bionomics didn't make a profit in the last twelve months, we'll focus on revenue growth to form a quick view of its business development. When a company doesn't make profits, we'd generally expect to see good revenue growth. That's because it's hard to be confident a company will be sustainable if revenue growth is negligible, and it never makes a profit.
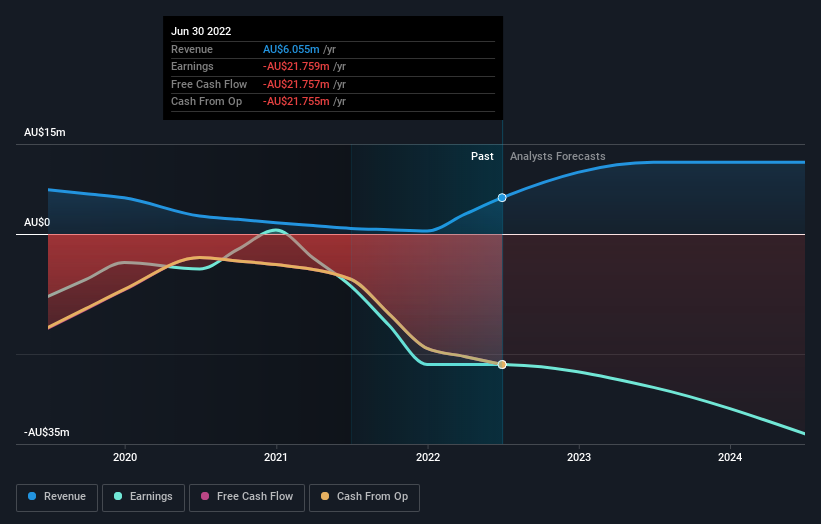
In the last five years Bionomics saw its revenue shrink by 54% per year. That's definitely a weaker result than most pre-profit companies report. So it's not that strange that the share price dropped 13% per year in that period. We don't think this is a particularly promising picture. Of course, the poor performance could mean the market has been too severe selling down. That can happen.
You can see how earnings and revenue have changed over time in the image below (click on the chart to see the exact values).
This free interactive report on Bionomics' balance sheet strength is a great place to start, if you want to investigate the stock further.
What About The Total Shareholder Return (TSR)?
We'd be remiss not to mention the difference between Bionomics' total shareholder return (TSR) and its share price return. The TSR attempts to capture the value of dividends (as if they were reinvested) as well as any spin-offs or discounted capital raisings offered to shareholders. We note that Bionomics' TSR, at -84% is higher than its share price return of -86%. When you consider it hasn't been paying a dividend, this data suggests shareholders have benefitted from a spin-off, or had the opportunity to acquire attractively priced shares in a discounted capital raising.
A Different Perspective
We regret to report that Bionomics shareholders are down 50% for the year. Unfortunately, that's worse than the broader market decline of 2.6%. Having said that, it's inevitable that some stocks will be oversold in a falling market. The key is to keep your eyes on the fundamental developments. Regrettably, last year's performance caps off a bad run, with the shareholders facing a total loss of 13% per year over five years. Generally speaking long term share price weakness can be a bad sign, though contrarian investors might want to research the stock in hope of a turnaround. I find it very interesting to look at share price over the long term as a proxy for business performance. But to truly gain insight, we need to consider other information, too. For example, we've discovered 6 warning signs for Bionomics (2 shouldn't be ignored!) that you should be aware of before investing here.
If you like to buy stocks alongside management, then you might just love this free list of companies. (Hint: insiders have been buying them).
Please note, the market returns quoted in this article reflect the market weighted average returns of stocks that currently trade on AU exchanges.
Have feedback on this article? Concerned about the content? Get in touch with us directly. Alternatively, email editorial-team (at) simplywallst.com.
This article by Simply Wall St is general in nature. We provide commentary based on historical data and analyst forecasts only using an unbiased methodology and our articles are not intended to be financial advice. It does not constitute a recommendation to buy or sell any stock, and does not take account of your objectives, or your financial situation. We aim to bring you long-term focused analysis driven by fundamental data. Note that our analysis may not factor in the latest price-sensitive company announcements or qualitative material. Simply Wall St has no position in any stocks mentioned.
Join A Paid User Research Session
You’ll receive a US$30 Amazon Gift card for 1 hour of your time while helping us build better investing tools for the individual investors like yourself. Sign up here
