Black Diamond Group Limited's (TSE:BDI) Stock Is Going Strong: Is the Market Following Fundamentals?
Most readers would already be aware that Black Diamond Group's (TSE:BDI) stock increased significantly by 28% over the past three months. Since the market usually pay for a company’s long-term fundamentals, we decided to study the company’s key performance indicators to see if they could be influencing the market. Specifically, we decided to study Black Diamond Group's ROE in this article.
ROE or return on equity is a useful tool to assess how effectively a company can generate returns on the investment it received from its shareholders. Simply put, it is used to assess the profitability of a company in relation to its equity capital.
Check out our latest analysis for Black Diamond Group
How Do You Calculate Return On Equity?
The formula for return on equity is:
Return on Equity = Net Profit (from continuing operations) ÷ Shareholders' Equity
So, based on the above formula, the ROE for Black Diamond Group is:
11% = CA$33m ÷ CA$291m (Based on the trailing twelve months to September 2023).
The 'return' refers to a company's earnings over the last year. So, this means that for every CA$1 of its shareholder's investments, the company generates a profit of CA$0.11.
What Is The Relationship Between ROE And Earnings Growth?
So far, we've learned that ROE is a measure of a company's profitability. We now need to evaluate how much profit the company reinvests or "retains" for future growth which then gives us an idea about the growth potential of the company. Assuming all else is equal, companies that have both a higher return on equity and higher profit retention are usually the ones that have a higher growth rate when compared to companies that don't have the same features.
A Side By Side comparison of Black Diamond Group's Earnings Growth And 11% ROE
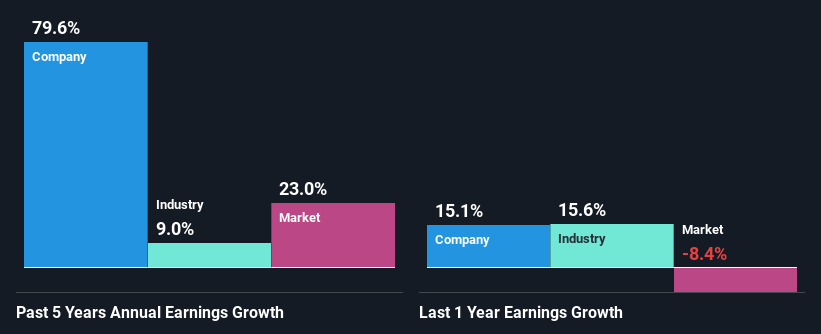
To start with, Black Diamond Group's ROE looks acceptable. On comparing with the average industry ROE of 9.2% the company's ROE looks pretty remarkable. This certainly adds some context to Black Diamond Group's exceptional 80% net income growth seen over the past five years. However, there could also be other causes behind this growth. For example, it is possible that the company's management has made some good strategic decisions, or that the company has a low payout ratio.
As a next step, we compared Black Diamond Group's net income growth with the industry, and pleasingly, we found that the growth seen by the company is higher than the average industry growth of 9.0%.
Earnings growth is a huge factor in stock valuation. The investor should try to establish if the expected growth or decline in earnings, whichever the case may be, is priced in. By doing so, they will have an idea if the stock is headed into clear blue waters or if swampy waters await. What is BDI worth today? The intrinsic value infographic in our free research report helps visualize whether BDI is currently mispriced by the market.
Is Black Diamond Group Making Efficient Use Of Its Profits?
Black Diamond Group has a really low three-year median payout ratio of 13%, meaning that it has the remaining 87% left over to reinvest into its business. So it looks like Black Diamond Group is reinvesting profits heavily to grow its business, which shows in its earnings growth.
Moreover, Black Diamond Group is determined to keep sharing its profits with shareholders which we infer from its long history of paying a dividend for at least ten years.
Summary
Overall, we are quite pleased with Black Diamond Group's performance. In particular, it's great to see that the company is investing heavily into its business and along with a high rate of return, that has resulted in a sizeable growth in its earnings. With that said, on studying the latest analyst forecasts, we found that while the company has seen growth in its past earnings, analysts expect its future earnings to shrink. To know more about the latest analysts predictions for the company, check out this visualization of analyst forecasts for the company.
Have feedback on this article? Concerned about the content? Get in touch with us directly. Alternatively, email editorial-team (at) simplywallst.com.
This article by Simply Wall St is general in nature. We provide commentary based on historical data and analyst forecasts only using an unbiased methodology and our articles are not intended to be financial advice. It does not constitute a recommendation to buy or sell any stock, and does not take account of your objectives, or your financial situation. We aim to bring you long-term focused analysis driven by fundamental data. Note that our analysis may not factor in the latest price-sensitive company announcements or qualitative material. Simply Wall St has no position in any stocks mentioned.
