Bloom Energy (BE): A Smart Investment or a Value Trap? An In-Depth Exploration
Value-focused investors are always on the hunt for stocks that are priced below their intrinsic value. One such stock that merits attention is Bloom Energy Corp (NYSE:BE). The stock, currently priced at 11.83, recorded a gain of 3.5% in a day and a 3-month decrease of 36.25%. The stock's fair valuation is $24.6, as indicated by its GF Value.
Understanding GF Value
The GF Value represents the current intrinsic value of a stock derived from our exclusive method. The GF Value Line on our summary page gives an overview of the fair value that the stock should be traded at. It is calculated based on three factors: historical multiples (PE Ratio, PS Ratio, PB Ratio, etc.), GuruFocus adjustment factor based on the company's past returns and growth, and future estimates of the business performance. The stock price will most likely fluctuate around the GF Value Line, with overvaluation indicating poor future returns and undervaluation suggesting higher future returns.
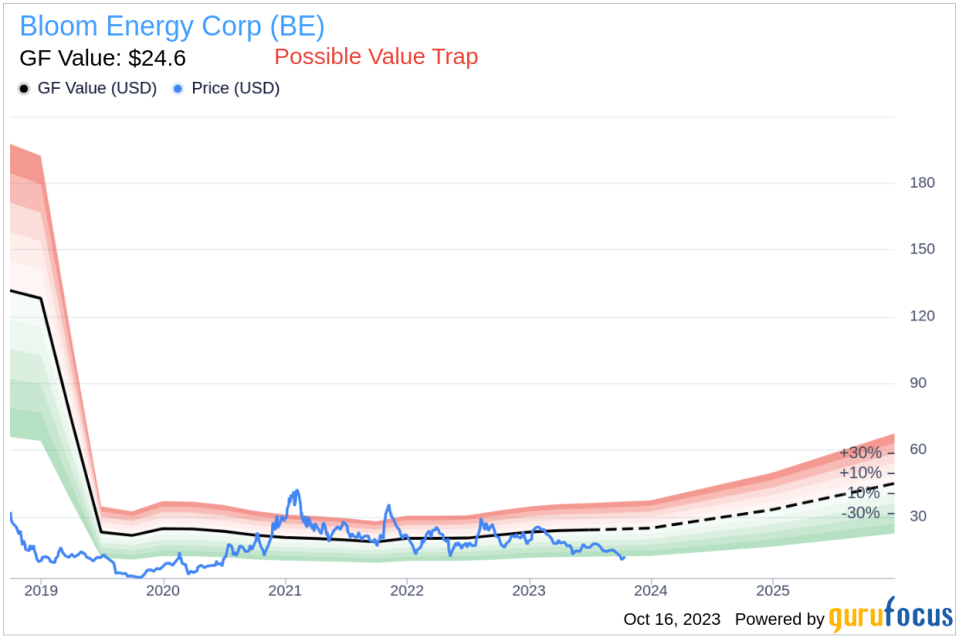
However, investors need to consider a more in-depth analysis before making an investment decision. Despite its seemingly attractive valuation, certain risk factors associated with Bloom Energy should not be ignored. These risks are primarily reflected through its low Altman Z-score of -0.55, a Beneish M-Score of -0.69 that exceeds -1.78, and a downward trend in the company's revenues per share and Earnings Per Share (EPS) over the past five years. These indicators suggest that Bloom Energy, despite its apparent undervaluation, might be a potential value trap. This complexity underlines the importance of thorough due diligence in investment decision-making.
Interpreting Altman Z-score and Beneish M-score
Before delving into the details, let's understand what the Altman Z-score entails. Invented by New York University Professor Edward I. Altman in 1968, the Z-Score is a financial model that predicts the probability of a company entering bankruptcy within a two-year time frame. The Altman Z-Score combines five different financial ratios, each weighted to create a final score. A score below 1.8 suggests a high likelihood of financial distress, while a score above 3 indicates a low risk.
Developed by Professor Messod Beneish, the Beneish M-Score is based on eight financial variables that reflect different aspects of a company's financial performance and position. These are Days Sales Outstanding (DSO), Gross Margin (GM), Total Long-term Assets Less Property, Plant and Equipment over Total Assets (TATA), change in Revenue (?REV), change in Depreciation and Amortization (?DA), change in Selling, General and Admin expenses (?SGA), change in Debt-to-Asset Ratio (?LVG), and Net Income Less Non-Operating Income and Cash Flow from Operations over Total Assets (?NOATA).
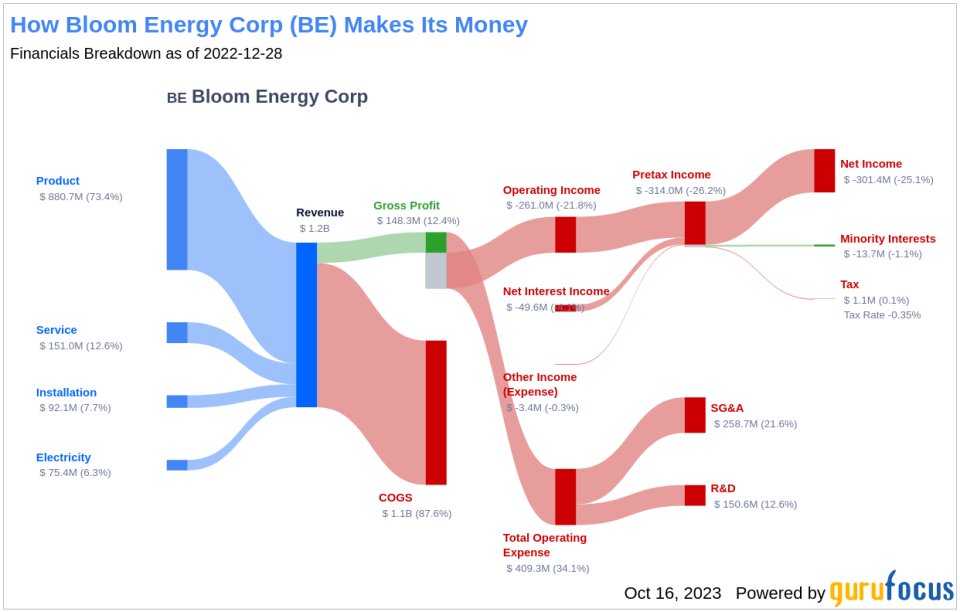
Company Overview
Bloom Energy Corp (NYSE:BE) is a company that designs, manufactures, sells, and installs solid-oxide fuel cell systems, known as "Energy Servers," for on-site power generation. These servers are fuel-flexible and can use natural gas, biogas, and hydrogen to create 24/7 electricity for stationary applications. In 2021, the company announced plans to leverage its technology and enter the electrolyzer market. Despite its innovative business model, Bloom Energy's financial metrics suggest potential risks for investors.
Breaking Down Bloom Energy's Low Altman Z-Score
A dissection of Bloom Energy's Altman Z-score reveals that the company's financial health may be weak, suggesting possible financial distress:
The Retained Earnings to Total Assets ratio provides insights into a company's capability to reinvest its profits or manage debt. Evaluating Bloom Energy's historical data, 2021: -2.17; 2022: -2.19; 2023: -1.36, we observe a recent decline following an initial increase in this ratio. This downward movement indicates Bloom Energy's diminishing ability to reinvest in its business or effectively manage its debt. Consequently, it exerts a negative impact on its Z-Score.
The EBIT to Total Assets ratio serves as a crucial barometer of a company's operational effectiveness, correlating earnings before interest and taxes (EBIT) to total assets. An analysis of Bloom Energy's EBIT to Total Assets ratio from historical data (2021: -0.05; 2022: -0.15; 2023: -0.08) indicates a recent dip following an initial rise. This reduction suggests that Bloom Energy might not be utilizing its assets to their full potential to generate operational profits, which could be negatively affecting the company's overall Z-score.
The Gross Margin index tracks the evolution of a company's gross profit as a proportion of its revenue. A downward trend could indicate issues such as overproduction or more generous credit terms, both of which are potential red flags for earnings manipulation. By examining the past three years of Bloom Energy's historical data (2021: 24.26; 2022: 13.23; 2023: 17.50), we find that its Gross Margin has contracted by 2.95%. Such a contraction in the gross margin can negatively impact the company's profitability as it signifies lesser income from each dollar of sales. This could put a strain on the company's capacity to manage operating costs, potentially undermining its financial stability.
The change in Depreciation, Depletion, and Amortization (DDA) reflects the rate at which a company's assets lose value over time. Analyzing Bloom Energy's DDA data over the past three years (2021: 53.24; 2022: 57.34; 2023: 66.58), a decreasing rate might be a cause for concern. This decline may suggest that the company is prolonging the useful life of its assets, possibly to manipulate earnings. By extending the lifespan of assets, depreciation charges are spread over a longer period, thereby reducing annual expenses and artificially boosting reported profits. While this may create a more favorable short-term financial picture, it could also distort the true value and condition of the company's assets, misleading investors and potentially hiding underlying operational or financial issues.
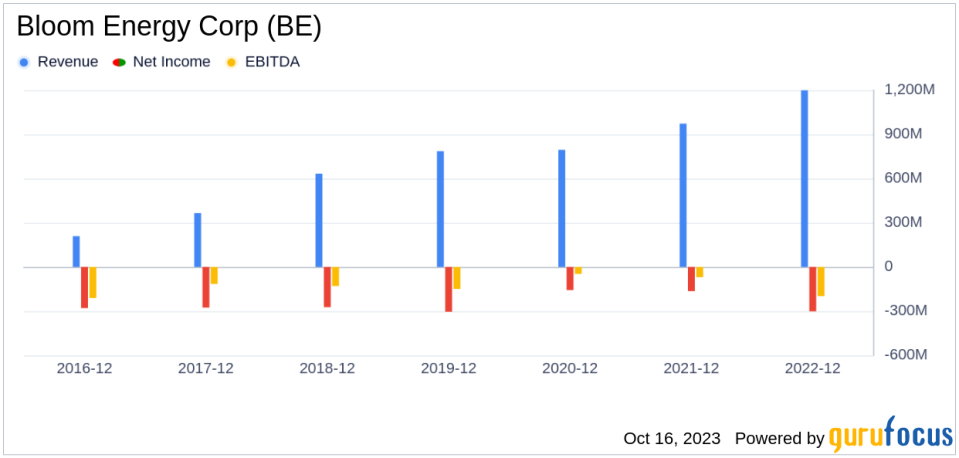
Warning Signs: Declining Revenues and Earnings
A declining trend in revenues per share is a telltale indicator of a company's potential trouble. In the case of Bloom Energy, both the revenue per share (evident from the last five years' TTM data: 2019: 6.37; 2020: 6.49; 2021: 5.40; 2022: 5.63; 2023: 6.64) and the 5-year revenue growth rate (-6.3%) have shown signs of decline. This pattern may point to underlying challenges such as diminishing demand for Bloom Energy's products, or escalating competition in its market sector. Either scenario can pose serious risks to the company's future performance, warranting a thorough analysis by investors.
The Red Flag: Sluggish Earnings Growth
Despite its low price-to-fair-value ratio, Bloom Energy's falling revenues and earnings cast a long shadow over its investment attractiveness. A low price relative to intrinsic value can indeed suggest an investment opportunity, but only if the company's fundamentals are sound or improving. In Bloom Energy's case, the declining revenues, EBITDA, and earnings growth suggest that the company's issues may be more than just cyclical fluctuations. Without a clear turnaround strategy, there's a risk that the company's performance could continue to deteriorate, leading to further price declines. In such a scenario, the low price-to-GF-Value ratio may be more indicative of a value trap than a value opportunity.
Conclusion
In conclusion, while Bloom Energy's current stock price appears undervalued relative to its GF Value, the company's declining revenues and earnings, coupled with its low Altman Z-Score and high Beneish M-Score, suggest potential financial distress and earnings manipulation. These factors indicate that Bloom Energy might be a value trap rather than a value opportunity. Investors should exercise caution and conduct thorough due diligence before considering an investment in Bloom Energy.
GuruFocus Premium members can find stocks with high Altman Z-Score using the following Screener: Walter Schloss Screen.
To find out the high quality companies that may deliver above-average returns, please check out GuruFocus High Quality Low Capex Screener.
Investors can find stocks with good revenue and earnings growth using GuruFocus' Peter Lynch Growth with Low Valuation Screener.
This article, generated by GuruFocus, is designed to provide general insights and is not tailored financial advice. Our commentary is rooted in historical data and analyst projections, utilizing an impartial methodology, and is not intended to serve as specific investment guidance. It does not formulate a recommendation to purchase or divest any stock and does not consider individual investment objectives or financial circumstances. Our objective is to deliver long-term, fundamental data-driven analysis. Be aware that our analysis might not incorporate the most recent, price-sensitive company announcements or qualitative information. GuruFocus holds no position in the stocks mentioned herein.
This article first appeared on GuruFocus.
