Is Bloom Energy (BE) Too Good to Be True? A Comprehensive Analysis of a Potential Value Trap
Value-focused investors are always on the lookout for stocks priced below their intrinsic value. One such stock that deserves consideration is Bloom Energy Corp (NYSE:BE). Currently priced at $12.41, the stock recorded a single-day loss of 6.41% and a 3-month decrease of 22.75%. The stock's fair valuation, as indicated by its GF Value, is $24.64. However, investors need to conduct a thorough analysis before making an investment decision. Despite its seemingly attractive valuation, Bloom Energy presents certain risk factors that should not be overlooked.
Understanding GF Value
The GF Value represents the current intrinsic value of a stock derived from our unique method. The GF Value Line on our summary page provides an overview of the fair value that the stock should be traded at. It is calculated based on three factors: historical multiples that the stock has traded at, GuruFocus adjustment factor based on the company's past returns and growth, and future estimates of the business performance.
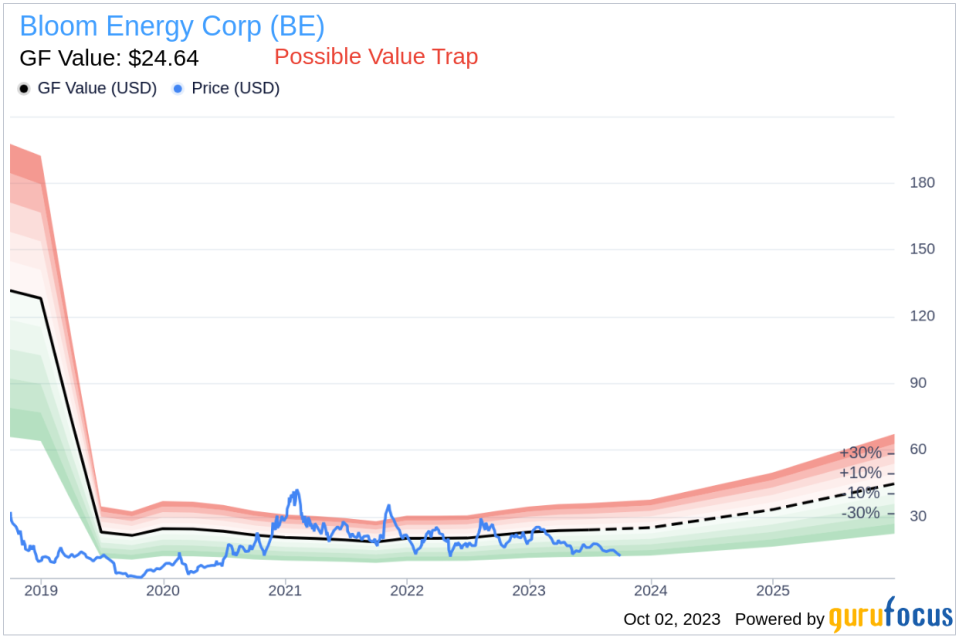
However, despite its apparent undervaluation, Bloom Energy might be a potential value trap. This is primarily reflected through its low Altman Z-score of -0.44, and a Beneish M-Score of -0.69 that exceeds -1.78, the threshold for potential earnings manipulation. Additionally, the company's revenues and earnings have been on a downward trend over the past five years. This raises a crucial question: Is Bloom Energy a hidden gem or a value trap?
Decoding Altman Z-Score and Beneish M-Score
Invented by New York University Professor Edward I. Altman in 1968, the Altman Z-score is a financial model that predicts the probability of a company entering bankruptcy within a two-year time frame. It combines five different financial ratios, each weighted to create a final score. A score below 1.8 suggests a high likelihood of financial distress, while a score above 3 indicates a low risk.
Developed by Professor Messod Beneish, the Beneish M-Score is based on eight financial variables that reflect different aspects of a company's financial performance and position. These include Days Sales Outstanding (DSO), Gross Margin (GM), Total Long-term Assets Less Property, Plant and Equipment over Total Assets (TATA), change in Revenue (?REV), change in Depreciation and Amortization (?DA), change in Selling, General and Admin expenses (?SGA), change in Debt-to-Asset Ratio (?LVG), and Net Income Less Non-Operating Income and Cash Flow from Operations over Total Assets (?NOATA).
Company Overview
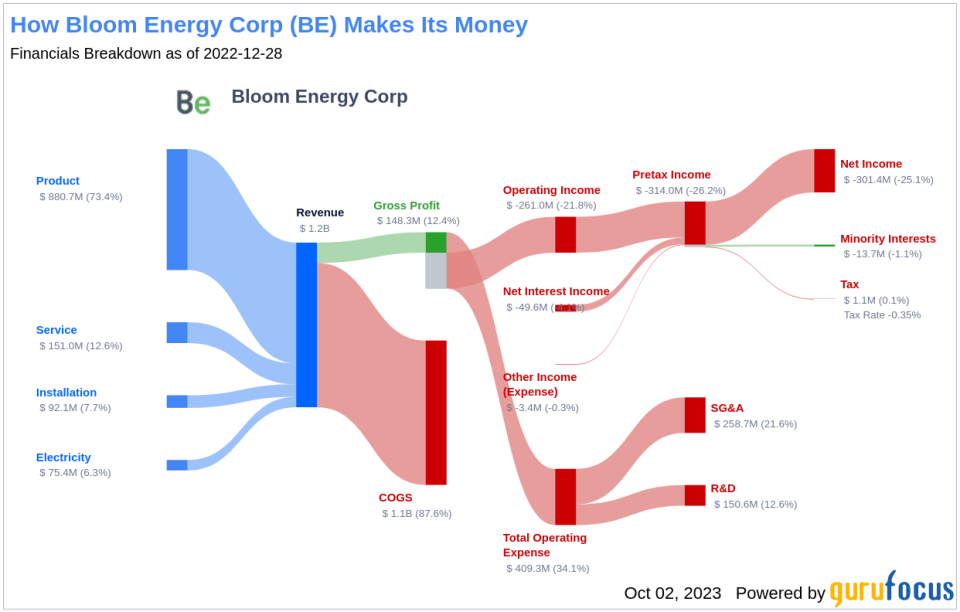
Bloom Energy Corp (NYSE:BE), designs, manufactures, sells, and installs solid-oxide fuel cell systems, known as "Energy Servers," for on-site power generation. These servers are fuel-flexible and can use natural gas, biogas, and hydrogen to create 24/7 electricity for stationary applications. In 2021, Bloom announced plans to leverage its technology and enter the electrolyzer market. The company primarily sells its systems in the United States and South Korea.
Examining Bloom Energy's Low Altman Z-Score
Bloom Energy's Altman Z-score suggests potential financial distress. The Retained Earnings to Total Assets ratio provides insights into a company's capability to reinvest its profits or manage debt. Evaluating Bloom Energy's historical data, 2021: -2.17; 2022: -2.19; 2023: -1.36, we observe a recent decline following an initial increase in this ratio. This downward movement indicates Bloom Energy's diminishing ability to reinvest in its business or effectively manage its debt, negatively impacting its Z-Score.
The EBIT to Total Assets ratio serves as a crucial barometer of a company's operational effectiveness, correlating earnings before interest and taxes (EBIT) to total assets. An analysis of Bloom Energy's EBIT to Total Assets ratio from historical data (2021: -0.05; 2022: -0.15; 2023: -0.08) indicates a recent dip following an initial rise. This reduction suggests that Bloom Energy might not be utilizing its assets to their full potential to generate operational profits, which could be negatively affecting the company's overall Z-score.
Warning Signs: Declining Revenues and Earnings
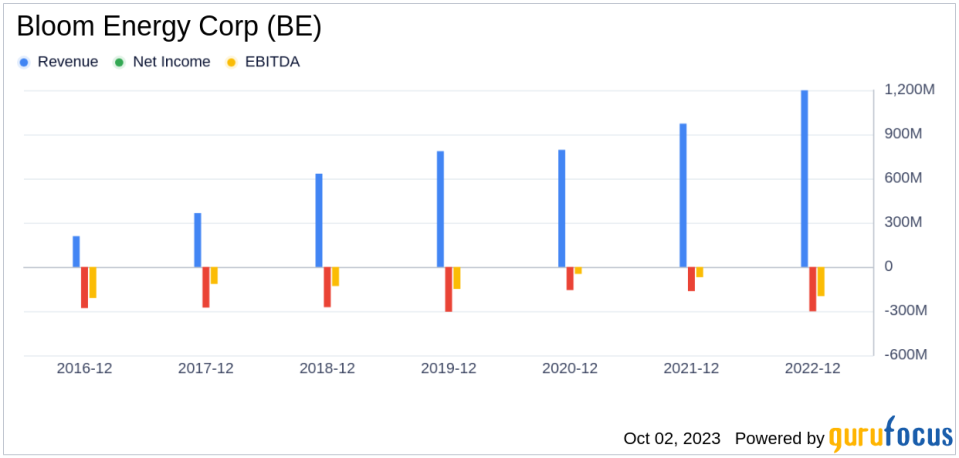
A sustained decline in revenues is a telltale indicator of a company's potential trouble. In the case of Bloom Energy, both the revenue per share (evident from the last five years' TTM data: 2019: 6.37; 2020: 6.49; 2021: 5.40; 2022: 5.63; 2023: 6.64; ) and the 5-year revenue growth rate (-6.3%) have been on a consistent downward trajectory. This pattern may point to underlying challenges such as diminishing demand for Bloom Energy's products, or escalating competition in its market sector. Either scenario can pose serious risks to the company's future performance, warranting a thorough analysis by investors.
Conclusion
Despite its low price-to-fair-value ratio, Bloom Energy's falling revenues and earnings cast a long shadow over its investment attractiveness. A low price relative to intrinsic value can indeed suggest an investment opportunity, but only if the company's fundamentals are sound or improving. In Bloom Energy's case, the declining revenues, EBITDA, and earnings growth suggest that the company's issues may be more than just cyclical fluctuations. Without a clear turnaround strategy, there's a risk that the company's performance could continue to deteriorate, leading to further price declines. In such a scenario, the low price-to-GF-Value ratio may be more indicative of a value trap than a value opportunity.
GuruFocus Premium members can find stocks with high Altman Z-Score using the following Screener: Walter Schloss Screen . To find out the high quality companies that may deliver above average returns, please check out GuruFocus High Quality Low Capex Screener. Investors can find stocks with good revenue and earnings growth using GuruFocus' Peter Lynch Growth with Low Valuation Screener.
This article first appeared on GuruFocus.
