Has Bonterra Energy Corp (TSE:BNE) Been Employing Capital Shrewdly?

Today we are going to look at Bonterra Energy Corp (TSE:BNE) to see whether it might be an attractive investment prospect. Specifically, we’re going to calculate its Return On Capital Employed (ROCE), in the hopes of getting some insight into the business.
First, we’ll go over how we calculate ROCE. Second, we’ll look at its ROCE compared to similar companies. Then we’ll determine how its current liabilities are affecting its ROCE.
What is Return On Capital Employed (ROCE)?
ROCE is a metric for evaluating how much pre-tax income (in percentage terms) a company earns on the capital invested in its business. In general, businesses with a higher ROCE are usually better quality. Ultimately, it is a useful but imperfect metric. Author Edwin Whiting says to be careful when comparing the ROCE of different businesses, since ‘No two businesses are exactly alike.’
So, How Do We Calculate ROCE?
Analysts use this formula to calculate return on capital employed:
Return on Capital Employed = Earnings Before Interest and Tax (EBIT) ÷ (Total Assets – Current Liabilities)
Or for Bonterra Energy:
0.039 = CA$20m ÷ (CA$1.1b – CA$64m) (Based on the trailing twelve months to September 2018.)
So, Bonterra Energy has an ROCE of 3.9%.
View our latest analysis for Bonterra Energy
Want to participate in a short research study? Help shape the future of investing tools and receive a $60 prize!
Is Bonterra Energy’s ROCE Good?
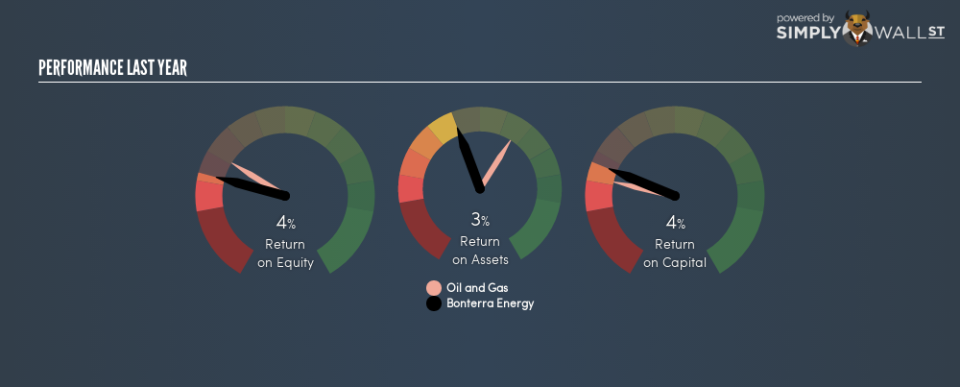
One way to assess ROCE is to compare similar companies. It appears that Bonterra Energy’s ROCE is fairly close to the Oil and Gas industry average of 4.8%. Independently of how Bonterra Energy compares to its industry, its ROCE in absolute terms is low; especially compared to the ~1.9% available in government bonds. There are potentially more appealing investments elsewhere.
Our data shows that Bonterra Energy currently has an ROCE of 3.9%, compared to its ROCE of 2.7% 3 years ago. This makes us wonder if the company is improving.
Remember that this metric is backwards looking – it shows what has happened in the past, and does not accurately predict the future. Companies in cyclical industries can be difficult to understand using ROCE, as returns typically look high during boom times, and low during busts. This is because ROCE only looks at one year, instead of considering returns across a whole cycle. We note Bonterra Energy could be considered a cyclical business. Since the future is so important for investors, you should check out our free report on analyst forecasts for Bonterra Energy.
What Are Current Liabilities, And How Do They Affect Bonterra Energy’s ROCE?
Liabilities, such as supplier bills and bank overdrafts, are referred to as current liabilities if they need to be paid within 12 months. Due to the way ROCE is calculated, a high level of current liabilities makes a company look as though it has less capital employed, and thus can (sometimes unfairly) boost the ROCE. To counter this, investors can check if a company has high current liabilities relative to total assets.
Bonterra Energy has total assets of CA$1.1b and current liabilities of CA$64m. Therefore its current liabilities are equivalent to approximately 5.6% of its total assets. With barely any current liabilities, there is minimal impact on Bonterra Energy’s admittedly low ROCE.
Our Take On Bonterra Energy’s ROCE
Nevertheless, there are potentially more attractive companies to invest in. You might be able to find a better buy than Bonterra Energy. If you want a selection of possible winners, check out this free list of interesting companies that trade on a P/E below 20 (but have proven they can grow earnings).
If you like to buy stocks alongside management, then you might just love this free list of companies. (Hint: insiders have been buying them).
To help readers see past the short term volatility of the financial market, we aim to bring you a long-term focused research analysis purely driven by fundamental data. Note that our analysis does not factor in the latest price-sensitive company announcements.
The author is an independent contributor and at the time of publication had no position in the stocks mentioned. For errors that warrant correction please contact the editor at editorial-team@simplywallst.com.
