Boston Beer (SAM) Q3 Earnings Beat, EPS View Cut Hurts Stock
The Boston Beer Company, Inc. SAM reported third-quarter 2023 results, wherein the top and bottom lines beat the Zacks Consensus Estimate and improved year over year. The performance mainly reflected strong growth in Twisted Tea and Hard Mountain Dew brands, offset by continuing challenges in Truly, Angry Orchard, Samuel Adams and Dogfish Head brands.
Adjusted earnings per share of $4.66 in third-quarter 2023 increased 22% from the $3.82 reported in the year-ago quarter. Earnings also beat the Zacks Consensus Estimate of $4.25. This mainly resulted from top-line growth, complemented by higher gross margins and operating income.
Net revenues improved 0.9% year over year to $601.6 million and beat the Zacks Consensus Estimate of $593 million. Excluding excise taxes, the top line rose 0.8% year over year to $639.4 million.
Despite the strong performance, the company anticipates soft volume trends for the fourth quarter. Consequently, it provided an adverse volume for 2023 and lowered the earnings per share guidance. Backed by the negative sentiment on the outlook, shares of Boston Beer declined 1.9% in the after-hours trading session on Oct 27, 2023.
The Zacks Rank #3 (Hold) stock has lost 0.3% in the past three months compared with the industry’s 16.7% decline.
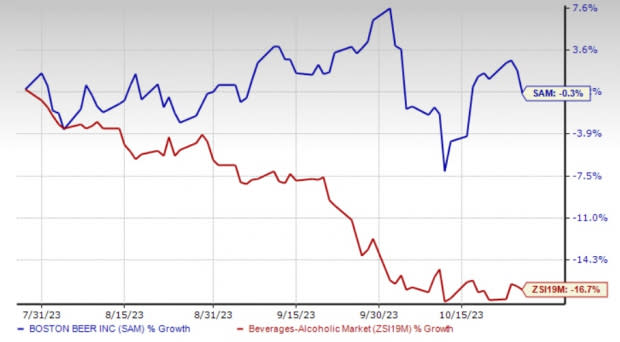
Image Source: Zacks Investment Research
Quarter in Detail
The shipment volume declined 2.5% from the year-ago period to 2.3 million barrels in the third quarter of 2023, whereas depletions fell 6%. Decreased shipment and depletion resulted from declines in the Truly, Angry Orchard, Samuel Adams and Dogfish Head brands. These were partly negated by growth in the Twisted Tea and Hard Mountain Dew brands.
Our model estimated the shipment volume to decline 3% and depletion to decrease 3.5% in the quarter under review.
The gross profit increased 6.6% year over year to $274.6 million, whereas it expanded 250 basis points (bps) to 45.7% from 43.2% in the year-ago quarter. The gross margin primarily benefited from strong price realization, reduced inventory obsolescence and procurement savings, partly offset higher inflationary costs.
We estimated the gross profit to increase 6.1% year over year in the third quarter, with a 300-bps expansion in the gross margin to 46.2%.
The Boston Beer Company, Inc. Price, Consensus and EPS Surprise
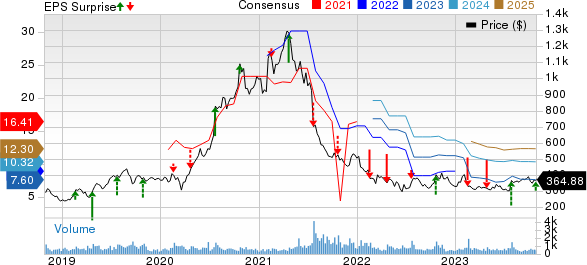
The Boston Beer Company, Inc. price-consensus-eps-surprise-chart | The Boston Beer Company, Inc. Quote
Advertising, promotional and selling expenses declined 0.7% in the reported quarter to $152.6 million due to lower freight to distributors of $10.8 million on reduced rates and volumes. This was partly offset by higher brand investments and selling costs of $9.6 million mainly related to elevated salary and benefit costs, as well as increased media investments.
Our model had estimated advertising, promotional and selling expenses to increase 12.5% to $273.6 million in the quarter under review.
General and administrative expenses rose 13.2% year over year to $42.2 million mainly due to increased consulting costs, and higher salaries and benefits costs.
The operating profit increased 60.2% year over year to $61.5 million, whereas it expanded 380 basis points (bps) to 10.2% from 6.4% in the year-ago quarter.
We predicted the third-quarter GAAP operating margin to expand 460 bps year over year to 11%, driven by an improved gross margin and a 160-bps decline in the total operating expense rate.
Financials
As of Jul 1, 2023, Boston Beer had cash and cash equivalents of $310.8 million, and total stockholders’ equity of $1,120.8 million. The company currently has $150 million in its line of credit, which, along with its cash position, will be sufficient to meet cash requirements.
The company repurchased $69.4 million worth of shares in the year-to-date period. This included the repurchase of Class A shares worth $62.9 million during the nine months of 2023 (ended Sep 30, 2023) and the buyback of shares worth $6.6 million in the period from Oct 1, 2023, through Oct 20, 2023. As of Oct 20, 2023, the company had $290 million remaining under its existing share repurchase authorization worth $1.2 billion.
For 2023, capital spending is anticipated to be $60-$90 million compared with the $100-$140 million mentioned earlier.
Outlook
The company revised its volume and GAAP earnings guidance for 2023. Boston Beer envisions GAAP earnings per share of $6.04-$8.04 for 2023 compared with the prior mentioned $6.00-$10.00. The company’s adjusted earnings per share guidance excludes the impacts of ASU 2016-09 and the non-cash brand value impairments of $16.4 million or $0.96 per diluted share. Adjusted earnings per share are expected to be $7.00-$9.00 for 2023.
Depletions and shipments are expected to decline 5-7% compared with a dip of 2-8% stated earlier. This view includes the adverse impacts of 1% due to an additional 53rd week in 2022, while 2023 will have 52 weeks. On a 52-week comparable basis, the company expects depletions and shipments to decline 4-6% compared with a dip of 1-7% stated earlier. The 53rd week is likely to negatively impact the fourth-quarter volume trends by 6%.
The company estimates price increases of 2-3% for 2023 versus 1-3% growth mentioned previously. It anticipates positive price realization in the fourth quarter but at a lower level due to lower third-quarter price increases from the prior year.
SAM anticipates a gross margin of 42-43% for 2023 compared with the 41-43% mentioned earlier. The company's gross margin guidance integrates an expectation of elevated shortfall fees at third-party breweries and lower fixed cost absorption per barrel at its owned breweries due to lower seasonal volumes in the fourth quarter. Consequently, it expects the year-over-year gross margin improvement to be lesser in the fourth quarter than that reported in the earlier quarters.
Advertising, promotional and selling expenses in 2023 are expected to grow $25-$35 million, revised from $20-$40 million growth mentioned earlier. This does not include any change in freight costs for the shipment of products to distributors. The non-GAAP effective tax rate is anticipated to be 28%, excluding the impacts of ASU 2016-09.
Consumer Staple Stocks Worth a Look
We have highlighted three better-ranked stocks from the Consumer Staple sector, namely Dutch Bros BROS, PepsiCo Inc. PEP and Constellation Brands STZ.
Dutch Bros currently sports a Zacks Rank #1 (Strong Buy). Shares of BROS have lost 16.9% in the past three months. You can see the complete list of today's Zacks #1 Rank stocks here.
The Zacks Consensus Estimate for Dutch Bros’ current financial-year sales suggests growth of 29.6% from the year-ago period’s reported figures. BROS has a trailing four-quarter earnings surprise of 44.6%, on average.
PepsiCo currently has a Zacks Rank #2 (Buy). Shares of PEP have declined 15.2% in the past three months. The company has a trailing four-quarter earnings surprise of 5.6%, on average.
The Zacks Consensus Estimate for PepsiCo’s current financial-year sales and earnings suggests growth of 6.3% and 11.1%, respectively, from the year-ago period’s reported figures.
Constellation Brands has a trailing four-quarter earnings surprise of 4.3%, on average. It currently carries a Zacks Rank #2. Shares of STZ have declined 15% in the past three months.
The Zacks Consensus Estimate for Constellation Brands’ current financial-year sales and earnings suggests growth of 6.7% and 11.5%, respectively, from the year-ago period's reported figures.
Want the latest recommendations from Zacks Investment Research? Today, you can download 7 Best Stocks for the Next 30 Days. Click to get this free report
PepsiCo, Inc. (PEP) : Free Stock Analysis Report
Constellation Brands Inc (STZ) : Free Stock Analysis Report
The Boston Beer Company, Inc. (SAM) : Free Stock Analysis Report
Dutch Bros Inc. (BROS) : Free Stock Analysis Report
