Boston Properties (BXP) Q2 FFO and Revenues Beat Estimates
Boston Properties Inc.’s BXP second-quarter 2023 funds from operations (FFO) per share of $1.86 outpaced the Zacks Consensus Estimate of $1.80. However, the reported figure fell 4.1% year over year.
BXP’s quarterly results reflect better-than-anticipated revenues on healthy leasing activity. It raised its outlook for 2023 FFO per share.
Quarterly revenues from leases came in at $761.7 million, which surpassed the consensus mark of $752.8 million. Moreover, the figure rose 5.5% from $721.9 million reported in the year-ago quarter.
Quarter in Detail
Boston Properties’ rental revenues (excluding termination income) for the office portfolio came in at $714 million, which rose nearly 2.4% year over year. The same for the hotel & residential segment aggregated $26.2 million, indicating a jump of 1.2% year over year.
BXP’s share of same property net operating income (NOI) on a cash basis (excluding termination income) totaled $429.6 million, up 2.2% from the prior-year quarter’s $420.4 million.
Its share of EBITDAre (on a cash basis), as of Jun 30, 2023, was $468.9 million, up 3.5% from $453.1 million as of Mar 31, 2023.
BXP’s in-service properties occupancy fell 30 basis points sequentially to 88.3%. We estimated the same to be 88.7%.
Portfolio Activity
As of Jun 30, 2023, Boston Properties’ portfolio comprised 191 properties, encompassing 54.1 million square feet of space. This included 13 properties under construction/redevelopment.
During the second quarter, the company executed 938,000 square feet of leases with a weighted average lease term of eight years.
In the reported quarter, the company completed and fully placed in-service approximately 476,000 square foot premier workplace at 2100 Pennsylvania Avenue in Washington, D.C. Currently, about 62% of the space is occupied while 91% is leased (including vacant space, for which, the company has signed leases that have not yet commenced in accordance with GAAP).
The company also opened View Boston, a 63,000-square-foot observation deck, located on the top three floors of the Prudential Tower in Boston, MA.
Liquidity
Boston Properties exited second-quarter 2023 cash and cash equivalents with $1.58 billion, up from $918.9 million as of Mar 31, 2023.
BXP’s share of net debt to EBITDAre annualized was 7.31 as of Jun 30, 2023, down from 7.78 times as of Mar 31, 2023.
2023 Outlook Raised
Boston Properties projects FFO per share for third-quarter 2023 to be in the range of $1.83-$1.85. The Zacks Consensus Estimate for the same is currently pegged at $1.80, which lies within the guided range.
For 2023, FFO per share is expected to be in the band of $7.24-$7.29, up from $7.14-$7.20 projected earlier. The Zacks Consensus Estimate for the same is currently pegged at $7.16.
BXP revised its outlook for its share of the same property NOI on a cash basis (excluding termination income) to 1.5-2.5% from the previously guided range of 1-2.5%. The average in-service portfolio occupancy is retained in the band of 88-89.5%.
Boston Properties currently carries a Zacks Rank #3 (Hold). You can see the complete list of today’s Zacks #1 Rank (Strong Buy) stocks here.
Boston Properties, Inc. Price, Consensus and EPS Surprise
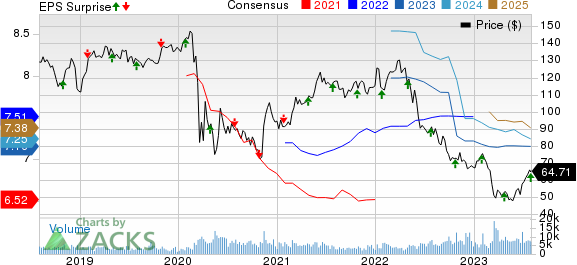
Boston Properties, Inc. price-consensus-eps-surprise-chart | Boston Properties, Inc. Quote
Performance of Other REITs
SL Green Realty Corp. SLG reported second-quarter 2023 FFO per share of $1.43, which surpassed the Zacks Consensus Estimate of $1.33. However, the figure fell from the year-ago quarter’s $1.87.
SLG’s results reflect a decline in occupancy for its Manhattan same-store office portfolio. However, it witnessed decent growth in same-store cash net operating income.
Crown Castle Inc. CCI reported second-quarter 2023 adjusted funds from operations per share of $2.05, outpacing the Zacks Consensus Estimate of $1.99. The reported figure climbed 13.9% from the year-ago quarter’s tally of $1.80.
Results reflect better-than-anticipated revenues, aided by robust site-rental revenue growth. However, the company lowered its outlook for 2023, citing that it expects a decline in tower activity for the remainder of the year due to reduced network spending by wireless carriers.
Note: Anything related to earnings presented in this write-up represent FFO — a widely used metric to gauge the performance of REITs.
Want the latest recommendations from Zacks Investment Research? Today, you can download 7 Best Stocks for the Next 30 Days. Click to get this free report
Boston Properties, Inc. (BXP) : Free Stock Analysis Report
Crown Castle Inc. (CCI) : Free Stock Analysis Report
SL Green Realty Corporation (SLG) : Free Stock Analysis Report
