Is Breedon Group plc's (LON:BREE) Recent Stock Performance Tethered To Its Strong Fundamentals?
Breedon Group's (LON:BREE) stock is up by a considerable 8.5% over the past month. Given the company's impressive performance, we decided to study its financial indicators more closely as a company's financial health over the long-term usually dictates market outcomes. Particularly, we will be paying attention to Breedon Group's ROE today.
ROE or return on equity is a useful tool to assess how effectively a company can generate returns on the investment it received from its shareholders. Put another way, it reveals the company's success at turning shareholder investments into profits.
Check out our latest analysis for Breedon Group
How Do You Calculate Return On Equity?
ROE can be calculated by using the formula:
Return on Equity = Net Profit (from continuing operations) ÷ Shareholders' Equity
So, based on the above formula, the ROE for Breedon Group is:
10% = UK£107m ÷ UK£1.1b (Based on the trailing twelve months to June 2023).
The 'return' is the income the business earned over the last year. Another way to think of that is that for every £1 worth of equity, the company was able to earn £0.10 in profit.
Why Is ROE Important For Earnings Growth?
So far, we've learned that ROE is a measure of a company's profitability. Depending on how much of these profits the company reinvests or "retains", and how effectively it does so, we are then able to assess a company’s earnings growth potential. Generally speaking, other things being equal, firms with a high return on equity and profit retention, have a higher growth rate than firms that don’t share these attributes.
Breedon Group's Earnings Growth And 10% ROE
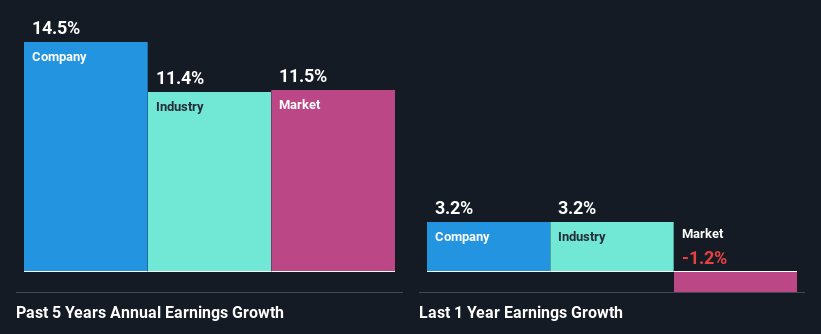
To start with, Breedon Group's ROE looks acceptable. And on comparing with the industry, we found that the the average industry ROE is similar at 11%. Consequently, this likely laid the ground for the decent growth of 15% seen over the past five years by Breedon Group.
As a next step, we compared Breedon Group's net income growth with the industry, and pleasingly, we found that the growth seen by the company is higher than the average industry growth of 11%.
The basis for attaching value to a company is, to a great extent, tied to its earnings growth. It’s important for an investor to know whether the market has priced in the company's expected earnings growth (or decline). By doing so, they will have an idea if the stock is headed into clear blue waters or if swampy waters await. What is BREE worth today? The intrinsic value infographic in our free research report helps visualize whether BREE is currently mispriced by the market.
Is Breedon Group Making Efficient Use Of Its Profits?
Breedon Group has a three-year median payout ratio of 31%, which implies that it retains the remaining 69% of its profits. This suggests that its dividend is well covered, and given the decent growth seen by the company, it looks like management is reinvesting its earnings efficiently.
While Breedon Group has been growing its earnings, it only recently started to pay dividends which likely means that the company decided to impress new and existing shareholders with a dividend. Upon studying the latest analysts' consensus data, we found that the company's future payout ratio is expected to rise to 39% over the next three years. Regardless, the ROE is not expected to change much for the company despite the higher expected payout ratio.
Summary
In total, we are pretty happy with Breedon Group's performance. Particularly, we like that the company is reinvesting heavily into its business, and at a high rate of return. Unsurprisingly, this has led to an impressive earnings growth. That being so, a study of the latest analyst forecasts show that the company is expected to see a slowdown in its future earnings growth. Are these analysts expectations based on the broad expectations for the industry, or on the company's fundamentals? Click here to be taken to our analyst's forecasts page for the company.
Have feedback on this article? Concerned about the content? Get in touch with us directly. Alternatively, email editorial-team (at) simplywallst.com.
This article by Simply Wall St is general in nature. We provide commentary based on historical data and analyst forecasts only using an unbiased methodology and our articles are not intended to be financial advice. It does not constitute a recommendation to buy or sell any stock, and does not take account of your objectives, or your financial situation. We aim to bring you long-term focused analysis driven by fundamental data. Note that our analysis may not factor in the latest price-sensitive company announcements or qualitative material. Simply Wall St has no position in any stocks mentioned.
