Brighthouse (BHF) Q4 Earnings Miss, Revenues Top Estimates

Brighthouse Financial Inc. BHF reported fourth-quarter 2023 adjusted net income of $2.92 per share, which missed the Zacks Consensus Estimate by 23.8%. The bottom line declined 16.8% year over year.
The results reflected higher revenues offset by higher expenses.
Behind the Headlines
Total operating revenues of $2.1 billion increased 5.4% year over year, driven by higher premiums, net investment income and other income. The top line beat the consensus mark by 0.2%.
Premiums of $226 million increased 35.5% year over year.
Adjusted net investment income was $1.2 billion in the quarter under review, up 13.3% year over year, primarily driven by alternative investment income, asset growth and higher interest rates. The investment income yield was 4.16%.
Total expenses were $2.6 million. Corporate expenses, pretax, were $224 million, a slight increase from $243 million incurred in the year ago quarter.
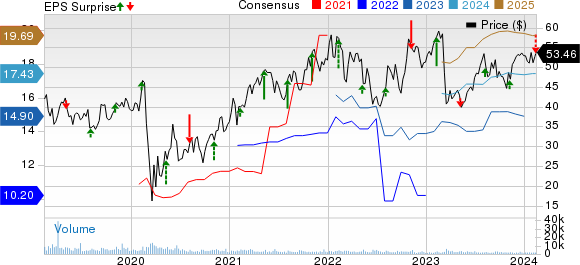
Brighthouse Financial, Inc. Price, Consensus and EPS Surprise
Brighthouse Financial, Inc. price-consensus-eps-surprise-chart | Brighthouse Financial, Inc. Quote
Quarterly Segmental Update
Annuities recorded an adjusted operating income of $245 million, up 26.3% year over year, attributable to lower fees, higher expenses and a lower underwriting margin. Annuity sales decreased 8% to $2.7 billion, attributable to lower fixed deferred annuity sales, partially offset by strong Shield Annuity sales.
Life’s adjusted operating income was $4 million, down 76.5% year over year. The year-over-year deterioration was due to a lower underwriting margin, partially offset by higher net investment income and lower expenses. Life insurance sales increased 28% to $29 million.
Adjusted operating loss at Run-off was $50 million against the year-ago income of $236 million, reflecting lower underwriting margin, partially offset by higher net investment income.
Corporate & Other incurred an adjusted operating loss of $22 million against the year-ago income of $98 million, reflecting lower tax benefits and higher expenses.
Financial Update
Cash and cash equivalents were $3.8 billion, down 6.4% year over year.
Shareholders’ equity of $4.9 billion at the end of 2023 decreased 10.7% year over year.
Book value per share, excluding accumulated other comprehensive income, was $133.69 as of Dec 31, 2023, down 8.2% year over year.
Statutory combined total adjusted capital was $6.3 billion as of Dec 31, 2023, down 22.2% year over year.
As of Dec 31, 2023, the estimated combined risk-based capital ratio was 420%.
Share Buyback Program
Brighthouse bought back shares worth $250 million in 2023, with another $30 million through Feb 9, 2024. The company has about $763 million remaining under its current share repurchase authorizations.
Zacks Rank
Brighthouse currently carries a Zacks Rank #3 (Hold). You can see the complete list of today’s Zacks #1 Rank (Strong Buy) stocks here.
Performance of Other Life Insurers
Reinsurance Group of America RGA reported fourth-quarter 2023 adjusted operating earnings of $4.73 per share, which beat the Zacks Consensus Estimate by 7.5%. Moreover, the bottom line increased 52.8% year over year.
RGA's operating revenues of $5.2 billion beat the Zacks Consensus Estimate by 13.2%. The top line also improved 18.2% year over year due to higher net premiums. Net premiums of $4.1 billion rose 19.2% year over year.
Voya Financial VOYA reported fourth-quarter 2023 adjusted operating earnings of $1.97 per share, which missed the Zacks Consensus Estimate by about 1%. The bottom line decreased 9.6% year over year due to disappointing net underwriting results, partially offset by higher fee income.
Adjusted operating revenues amounted to $236 million, which decreased 11.3% year over year. The top line missed the Zacks Consensus Estimate by 22.5%.
As of Dec 31, 2023, VOYA’s assets under management, assets under administration and advisement totaled $813.5 million.
Sun Life Financial Inc. SLF delivered fourth-quarter 2023 underlying net income of $1.23 per share, which beat the Zacks Consensus Estimate by 5.1%. However, the bottom line decreased 1.6% year over year. Underlying net income was $722 million (C$983 million), which increased 10% year over year. Revenues of $13.7 billion increased 51.5% year over year.
Wealth sales & asset management gross flows of $33.7 billion (C$45.8 billion) increased 5.7% year over year. Group - Health & Protection sales of $1.1 billion (C$1.5 billion) improved 8.5% year over year. Individual - Protection sales of $519.6 million (C$707 million) jumped 42% year over year. New business contractual service margin (CSM) was $280 million (C$381 million), up 51% year over year.
Want the latest recommendations from Zacks Investment Research? Today, you can download 7 Best Stocks for the Next 30 Days. Click to get this free report
Reinsurance Group of America, Incorporated (RGA) : Free Stock Analysis Report
Sun Life Financial Inc. (SLF) : Free Stock Analysis Report
Voya Financial, Inc. (VOYA) : Free Stock Analysis Report
Brighthouse Financial, Inc. (BHF) : Free Stock Analysis Report
