Brown & Brown's (BRO) Q3 Earnings Beat, Revenues Rise Y/Y
Brown & Brown, Inc.’s BRO third-quarter 2023 adjusted earnings of 71 cents per share beat the Zacks Consensus Estimate by 16.4%. The bottom line increased 42% year over year.
The quarterly results reflected stronger organic growth, improved EBITDAC margin and higher net investment income, partly offset by higher expenses.
Brown & Brown, Inc. Price, Consensus and EPS Surprise
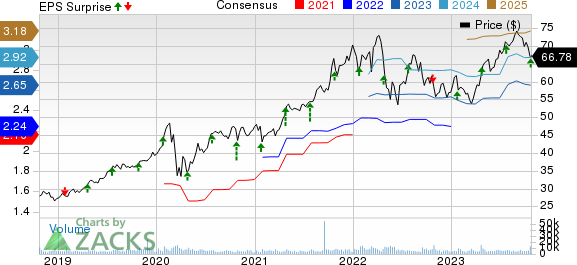
Brown & Brown, Inc. price-consensus-eps-surprise-chart | Brown & Brown, Inc. Quote
Q3 Details
Total revenues of $1.06 billion beat the Zacks Consensus Estimate by 3.8%. The top line improved 15.1% year over year. The upside can be primarily attributed to commission and fees, which grew 13.4% year over year to $1.04 billion. Our estimate for commission and fees growth was 8.7%.
Organic revenues improved 9.6% to $1 billion in the quarter under review.
Investment income increased year over year to $16.6 million from $1.2 million in the year-ago quarter. The Zacks Consensus Estimate for the metric was pegged at $7.2 million and our estimate was $2.4 million.
Adjusted EBITDAC was $370.3 million, up 27% year over year. EBITDAC margin expanded 350 basis points (bps) year over year to 34.7%. Our estimate for adjusted EBITDAC was $314.5 million.
Total expenses increased 16.3% to $825.4 million due to a rise in employee compensation and benefits and interest expenses. Our estimate was $787.9 million.
Financial Update
Brown & Brown exited the third quarter with cash and cash equivalents of $755.7 million, up 16.2% from the 2022-end level.
Long-term debt was $3.1 billion as of Sep 30, 2023, down 14.8% from 2022 end.
Net cash provided by operating activities in the first nine months of 2023 was $704.1 million, up 17.4% year over year.
Zacks Rank
Brown & Brown currently carries a Zacks Rank #3 (Hold). You can see the complete list of today’s Zacks #1 Rank (Strong Buy) stocks here.
Performance of Other Insurers
The Progressive Corporation’s PGR third-quarter 2023 earnings per share of $2.09 beat the Zacks Consensus Estimate of $1.71. The bottom line improved more than fourfold year over year. Net premiums written were $15.6 billion in the quarter, which grew 20% from $13 billion a year ago and beat our estimate of $14.2 billion.
Net premiums earned grew 20% to $14.9 billion and beat our estimate of $13.6 billion as well as the Zacks Consensus Estimate of $14.8 billion. Net realized losses on securities were $149 million, narrower than a loss of $216.4 million in the year-ago quarter. The combined ratio — the percentage of premiums paid out as claims and expenses — improved 680 bps from the prior-year quarter’s level to 92.4.
The Travelers Companies TRV reported its third-quarter 2023 core income of $1.95 per share, which missed the Zacks Consensus Estimate by 33.4%. The bottom line decreased 11.4% year over year. Travelers’ total revenues increased 14% from the year-ago quarter to $10.6 billion, primarily driven by higher premiums. The top-line figure beat the Zacks Consensus Estimate by 1.3%.
Net written premiums increased 14% year over year to a record $10.4 billion, driven by strong growth across all three segments. The figure was higher than our estimate of $9.4 billion. Net investment income increased 30% year over year to $769 million, primarily due to strong fixed-income returns. The figure was higher than our estimate of $655 million. The Zacks Consensus Estimate was pegged at $724 million. Catastrophe losses totaled $850 million, wider than $512 million pre-tax in the prior-year quarter. TRV witnessed an underwriting gain of $868 million, up 43% year over year. The combined ratio deteriorated 280 bps year over year to 101.
Marsh & McLennan Companies, Inc. MMC reported third-quarter 2023 adjusted earnings per share of $1.57, which surpassed the Zacks Consensus Estimate by 13.8%. The bottom line climbed 33% year over year. Its consolidated revenues amounted to $5,382 million, which improved 13% year over year in the quarter under review. The figure grew 10% on an underlying basis. Also, the top line beat the consensus mark by 3.7%.
Total operating expenses increased 10.2% year over year to $4,386 million in the third quarter due to higher compensation and benefits and other operating expenses. The reported figure also came higher than our estimate of $4,282.7 million. Total expenses in the Risk and Insurance Services segment escalated 10.4% year over year, while the same in the Consulting segment witnessed an 11.3% year-over-year increase. Total adjusted operating income of $1,059 million advanced 24% year over year and beat our estimate of $992.3 million. The adjusted operating margin improved 170 bps year over year to 21.3% in the quarter under review.
Want the latest recommendations from Zacks Investment Research? Today, you can download 7 Best Stocks for the Next 30 Days. Click to get this free report
The Travelers Companies, Inc. (TRV) : Free Stock Analysis Report
Marsh & McLennan Companies, Inc. (MMC) : Free Stock Analysis Report
The Progressive Corporation (PGR) : Free Stock Analysis Report
Brown & Brown, Inc. (BRO) : Free Stock Analysis Report
