Buckle And Other Great Cyclical Income Stocks

The economic cycle is the underlying driver of consumer cyclical companies’ performances. Businesses such as Buckle and Chico’s FAS offer products that are considered luxury items, rather than those of absolute necessity, for example gambling and day spas. In periods of growth, consumers benefit from higher discretionary income which drives these companies’ profitability. Higher profits by and large lead to higher dividend payout so economic growth is an opportune time to benefit from these consumer stocks. As a long term investor, I favour these consumer cyclical stocks with great dividend payments that continues to add value to my portfolio.
The Buckle, Inc. (NYSE:BKE)
BKE has a sumptuous dividend yield of 13.13% and pays 57.62% of it’s earnings as dividends . While there’s been some level of instability in the yield, BKE has overall increased DPS over a 10 year period from $0.6668 to $2.75. It should comfort potential investors that the company isn’t expensive when we look at its PE ratio compared to the US Specialty Retail industry. Buckle’s PE ratio is 12.1 while its industry average is 18.9. More on Buckle here.

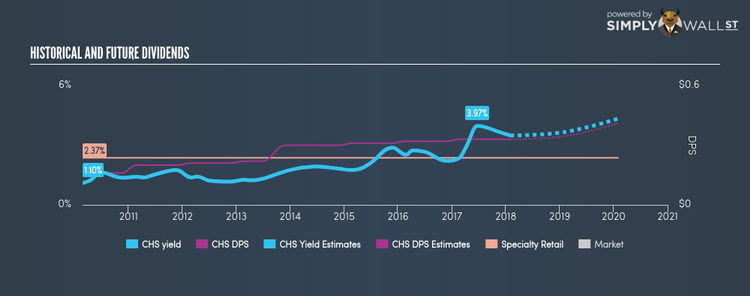
Chico’s FAS, Inc. (NYSE:CHS)
CHS has a solid dividend yield of 3.49% and the company has a payout ratio of 48.69% . With a yield above the savings rate, bank account beating investors will be happy, but perhaps even happier knowing that CHS is in the top quartile of market payers. More detail on Chico’s FAS here.
Tailored Brands, Inc. (NYSE:TLRD)
TLRD has a good dividend yield of 2.93% and pays out 52.50% of its profit as dividends . TLRD’s dividends have seen an increase over the past 10 years, with payments increasing from $0.28 to $0.72 in that time. They have been dependable too, not missing a single payment in this time. Tailored Brands is also reasonably priced, with a PE ratio of 17.9 that compares favorably with the US Specialty Retail average of 18.9. More on Tailored Brands here.

For more solid dividend payers to add to your portfolio, you can use our free platform to explore our interactive list of top dividend payers.
To help readers see pass the short term volatility of the financial market, we aim to bring you a long-term focused research analysis purely driven by fundamental data. Note that our analysis does not factor in the latest price sensitive company announcements.
The author is an independent contributor and at the time of publication had no position in the stocks mentioned.
