Burberry Group plc's (LON:BRBY) Stock Has Been Sliding But Fundamentals Look Strong: Is The Market Wrong?
With its stock down 27% over the past three months, it is easy to disregard Burberry Group (LON:BRBY). But if you pay close attention, you might gather that its strong financials could mean that the stock could potentially see an increase in value in the long-term, given how markets usually reward companies with good financial health. In this article, we decided to focus on Burberry Group's ROE.
Return on Equity or ROE is a test of how effectively a company is growing its value and managing investors’ money. In short, ROE shows the profit each dollar generates with respect to its shareholder investments.
See our latest analysis for Burberry Group
How Is ROE Calculated?
Return on equity can be calculated by using the formula:
Return on Equity = Net Profit (from continuing operations) ÷ Shareholders' Equity
So, based on the above formula, the ROE for Burberry Group is:
41% = UK£457m ÷ UK£1.1b (Based on the trailing twelve months to September 2023).
The 'return' is the profit over the last twelve months. Another way to think of that is that for every £1 worth of equity, the company was able to earn £0.41 in profit.
Why Is ROE Important For Earnings Growth?
We have already established that ROE serves as an efficient profit-generating gauge for a company's future earnings. Depending on how much of these profits the company reinvests or "retains", and how effectively it does so, we are then able to assess a company’s earnings growth potential. Assuming everything else remains unchanged, the higher the ROE and profit retention, the higher the growth rate of a company compared to companies that don't necessarily bear these characteristics.
Burberry Group's Earnings Growth And 41% ROE
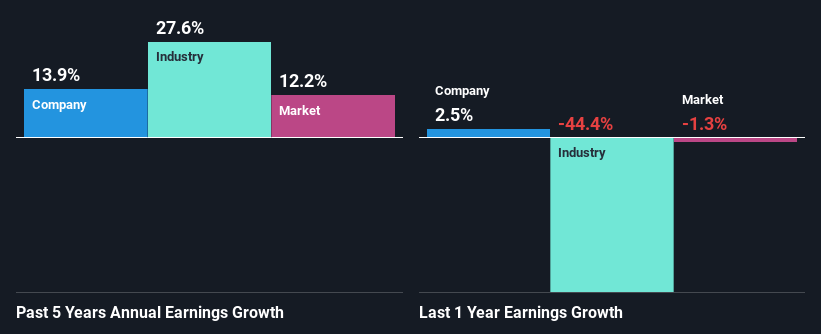
To begin with, Burberry Group has a pretty high ROE which is interesting. Secondly, even when compared to the industry average of 6.1% the company's ROE is quite impressive. Probably as a result of this, Burberry Group was able to see a decent net income growth of 14% over the last five years.
We then compared Burberry Group's net income growth with the industry and found that the company's growth figure is lower than the average industry growth rate of 28% in the same 5-year period, which is a bit concerning.
Earnings growth is an important metric to consider when valuing a stock. The investor should try to establish if the expected growth or decline in earnings, whichever the case may be, is priced in. Doing so will help them establish if the stock's future looks promising or ominous. Is BRBY fairly valued? This infographic on the company's intrinsic value has everything you need to know.
Is Burberry Group Efficiently Re-investing Its Profits?
Burberry Group has a three-year median payout ratio of 47%, which implies that it retains the remaining 53% of its profits. This suggests that its dividend is well covered, and given the decent growth seen by the company, it looks like management is reinvesting its earnings efficiently.
Additionally, Burberry Group has paid dividends over a period of at least ten years which means that the company is pretty serious about sharing its profits with shareholders. Based on the latest analysts' estimates, we found that the company's future payout ratio over the next three years is expected to hold steady at 56%. Still, forecasts suggest that Burberry Group's future ROE will drop to 29% even though the the company's payout ratio is not expected to change by much.
Summary
In total, we are pretty happy with Burberry Group's performance. Particularly, we like that the company is reinvesting heavily into its business, and at a high rate of return. As a result, the decent growth in its earnings is not surprising. With that said, the latest industry analyst forecasts reveal that the company's earnings growth is expected to slow down. To know more about the latest analysts predictions for the company, check out this visualization of analyst forecasts for the company.
Have feedback on this article? Concerned about the content? Get in touch with us directly. Alternatively, email editorial-team (at) simplywallst.com.
This article by Simply Wall St is general in nature. We provide commentary based on historical data and analyst forecasts only using an unbiased methodology and our articles are not intended to be financial advice. It does not constitute a recommendation to buy or sell any stock, and does not take account of your objectives, or your financial situation. We aim to bring you long-term focused analysis driven by fundamental data. Note that our analysis may not factor in the latest price-sensitive company announcements or qualitative material. Simply Wall St has no position in any stocks mentioned.
