Burlington Stores (BURL) Q3 Earnings & Sales Miss, Rise Y/Y
Burlington Stores, Inc. BURL reported third-quarter fiscal 2023 results, where sales and earnings missed the Zacks Consensus Estimate. However, both the top and bottom lines increased year over year.
Over the past three months, this Zacks Rank #3 (Hold) stock has gained 0.7% compared with the industry's growth of 1.8%.
Insight Into the Headlines
Burlington Stores delivered adjusted earnings of 98 cents per share, lagging the Zacks Consensus Estimate of earnings of 99 cents. The bottom line surged 127.9% from 43 cents per share recorded in the year-ago fiscal quarter.
Total revenues of $2,289.3 million fell short of the consensus estimate of $2,313 million but increased 12.2% from the last fiscal year’s quarterly reported figure. The company’s comparable store sales jumped 6% from the year-ago period, compared with our estimate of 6.4% growth.
Burlington Stores, Inc. Price, Consensus and EPS Surprise
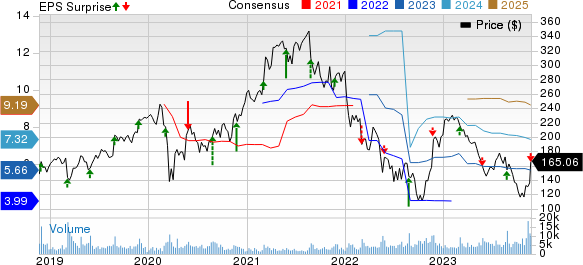
Burlington Stores, Inc. price-consensus-eps-surprise-chart | Burlington Stores, Inc. Quote
Margins
The gross margin was 43.2% in the reported quarter, up 200 basis points (bps) from third-quarter fiscal 2022 actuals. Notably, our estimate for the gross margin was also pegged at 43.2%. Merchandise margin increased by 150 bps and freight expenses improved by 50 bps.
Adjusted selling, general and administrative (SG&A) expenses, as a rate of sales, was 27.3%, increasing 50 bps from the third-quarter fiscal 2022 actuals. Our estimate for adjusted SG&A expenses, as a rate of sales, was 27.2%. Product sourcing costs included in SG&A expenses came in at $200 million, up from $177 million recorded in the fiscal year ago quarter. Product sourcing costs represent the processing goods expenses via supply chain and buying costs.
Adjusted EBITDA increased by 43.1% from the third quarter of fiscal 2022 to $176 million. Adjusted EBIT was $99 million, up from $55 million in the fiscal year ago quarter. Adjusted EBIT margin increased by 170 bps from the third quarter of fiscal 2022.
Other Financial Aspects
The company ended the reported quarter with cash and cash equivalents of $615.9 million, long-term debt of $1,397.6 million and stockholders’ equity of $850.5 million. BURL exited the fiscal third quarter with $1,440 million of liquidity, including $616 million of unrestricted cash and $824 million available under its ABL facility.
Burlington Stores ended the quarter with $1,412 million of outstanding total debt, comprising $940 million under its Term Loan Facility, $453 million of Convertible Notes and no borrowings under its ABL Facility.
Merchandise inventories were $1,329 million, down from $1,445 million reported in the fiscal year ago quarter. Comparable store inventories grew 2% from the level recorded in the same quarter of fiscal 2022. Reserve inventory accounted for 30% of the total inventory at the end of the reported quarter.
Burlington Stores bought back 348,948 shares for $52 million under its share repurchase plan in the fiscal third quarter. As of Oct 28, 2023, BURL had $718 million remaining under its current share repurchase authorization. It is worth noting that on Aug 15, 2023, Burlington Stores’ board of directors approved the repurchase of up to an additional $500 million of common stock.
Outlook
For fiscal 2023, comparable sales are anticipated to increase 3% against the 13% decrease reported during fiscal 2022. Net sales are expected to grow 11%, including an approximately 2% rise from the extra 53rd week, against a 7% fall in fiscal 2022.
Adjusted EBIT margin (excluding the impact of expected incremental expenses of 18 million related to the recently acquired Bed Bath & Beyond leases) is now expected to increase by 90-100 bps for the fiscal year. Adjusted earnings per share (EPS) are envisioned in the bracket of $5.72-$5.87 compared with an adjusted EPS of $4.26 recorded in the last fiscal year. The expected adjusted EPS excludes the impact of expected incremental expenses of 20 cents per share related to the acquired Bed Bath & Beyond leases.
In fiscal 2023, management intends to open approximately 80 net new stores and projects capital expenditures, net of landlord allowances, of $560 million. Net interest expense is expected to be about $60 million, while the effective tax rate is likely to be around 26%.
For the fourth quarter of fiscal 2023, total sales are projected to increase 5-7% and comps are expected to be in the range of 2% decline to flat from the year-ago period. Adjusted EBIT margin is likely to be up by 0-40 bps from the last fiscal year’s quarterly reading and adjusted EPS is forecast in the range of $3.10 to $3.25.
The forecasted adjusted EBIT margin and adjusted EPS figures exclude the impact of expected incremental expenses of about $5 million or 6 cents per share, associated with the acquired Bed Bath & Beyond lease. The metric also excludes the impact of 5 cents benefit expected from the 53rd week. Burlington Stores’ adjusted earnings were $2.96 per share in the fourth quarter of fiscal 2022.
The effective tax rate is likely to be about 27% for the fiscal fourth quarter.
Stocks to Consider
Some better-ranked stocks from the same sector are American Eagle Outfitters Inc. AEO, Abercrombie & Fitch Co. ANF and Deckers Outdoor Corporation DECK, each carrying a Zacks Rank #2 (Buy). You can see the complete list of today’s Zacks #1 Rank (Strong Buy) stocks here.
American Eagle Outfitters is a specialty retailer of casual apparel, accessories and footwear.
The Zacks Consensus Estimate for American Eagle Outfitters’ current fiscal-year earnings and sales indicates growth of 37.1% and 2.4%, respectively, from the previous year’s reported figures. AEO has a trailing four-quarter average earnings surprise of 43.2%.
Abercrombie & Fitch is a specialty retailer of premium, high-quality casual apparel. ANF delivered a significant earnings surprise in the last reported quarter. The Zacks Consensus Estimate for Abercrombie & Fitch’s current fiscal-year sales implies growth of 10.4% from the previous year’s reported number. ANF has a trailing four-quarter average earnings surprise of 724.8%.
Deckers Outdoor is a leading designer, producer and brand manager of innovative, niche footwear and accessories. The Zacks Consensus Estimate for Deckers’ current fiscal-year earnings and sales indicates growth of 20.9% and 11.4%, respectively, from the previous year’s reported figures. DECK has a trailing four-quarter average earnings surprise of 26.3%.
Want the latest recommendations from Zacks Investment Research? Today, you can download 7 Best Stocks for the Next 30 Days. Click to get this free report
Abercrombie & Fitch Company (ANF) : Free Stock Analysis Report
American Eagle Outfitters, Inc. (AEO) : Free Stock Analysis Report
Deckers Outdoor Corporation (DECK) : Free Stock Analysis Report
Burlington Stores, Inc. (BURL) : Free Stock Analysis Report
