
Buy This Stock's Breakout for a Chance at 17% Returns
Last week's pullback in U.S. stocks resulted in notable lower lows on the weekly charts of the major indices. This, coupled with negative divergence from momentum indicators and market internals (neither of which confirmed the recent new highs in the S&P 500 and other indices), gives the bears better odds of a market correction than potentially anytime this year.
That does not mean it's impossible to find trades on the long side, but it does require a little more digging than usual. So I scanned for stocks trading in tight patterns that have showed relative strength in recent weeks and came across CME Group (CME).
CME Group is the operator of a large derivatives exchange for futures contracts, options on futures, interest rates, stock indices, foreign exchange and commodities. Unlike the broader stock market, CME still trades well below its late 2007 peak.
The entire financial sector, as represented by the Financial Select Sector SPDR (XLF), is nowhere near its 2007 highs, even though it is one of the leading performers, on a percentage basis, since the bear market lows. I mention this to say that CME is not an underperformer, but rather a victim of a greater-than-average percentage drop from the 2007 highs.
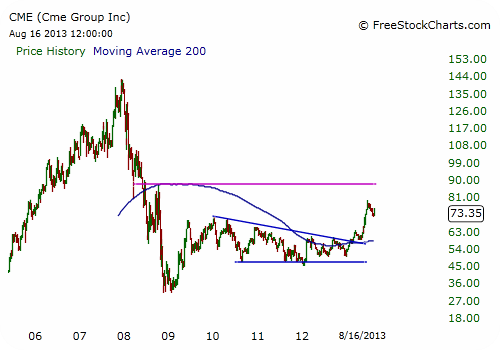
On the multi-year chart looking back to 2006, note that CME rallied strongly off its 2009 lows along with the broader market, but ran out of steam in January 2010. From there, the stock began a corrective slide, which formed an important higher high in the summer of 2010 versus the 2009 lows, and made another higher high in January 2012.
After trading in a slightly downtrending range for more than three years, CME developed enough upside momentum to finally breakout past the downtrend line and the 200-week simple moving average in the spring of 2013. After a brief retest of the downtrend line, the stock was ready for a sharp rally that pushed it to a significant higher high in June, thus completing the multi-year bottoming process.
On the daily chart below, CME has some clearly defined levels that should help us trade it.
The stock has developed what looks like a bull flag, which would be confirmed with a break past two-week resistance near $75.40. As this level not only coincides with two-week lateral resistance and the top of what may be a bull flag, but also with the stock's 50-day simple moving average, a break above it would likely accelerate CME higher.
Last week, CME broke out of a tight, seven-day consolidation phase, which defined the bottom range of the bull flag. This tight consolidation zone had a bearish tone that quickly turned into a bullish reversal, and such moves are often strong signs that the stock has much higher to go.
During the past four trading days, CME has again settled into a consolidation phase. A break above $75.40 would complete an important multi-week consolidation phase, which is nothing but bullish in the bigger picture.

Recommended Trade Setup:
-- Buy CME on a daily close at or above $75.40
-- Set stop-loss at $72.80
-- Set initial price target at $88 for a potential 17% gain in 5-10 weeks
Related Articles
Buying This Tech's Breakout Could Mean 10%-Plus Gains by Year-End
The Top 5 Income Stocks for Uneasy Investors
How to Generate Thousands in Income Even If the Next Bull Market is Years Away
