A CAD/JPY Pattern Two Years in the Making
Talking Points:
"Perfect" Elliott Wave Pattern in CAD/JPY
Start of a New Daily Uptrend
Key Support Zone for Buying CAD/JPY
Kaye Lee is enjoying holiday for the week ahead and new articles may appear less frequently during this time. The normal publication schedule will resume shortly after April 10.
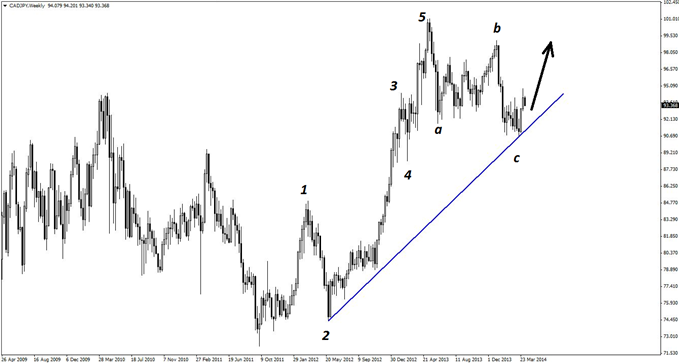
Textbook Elliott wave patterns are relatively rare, and even more so on weekly charts, where formations take months or even years to develop. Nonetheless, CADJPY appears to have recently completed a classic eight-wave pattern, as shown on the below weekly chart.
Guest Commentary: “Perfect” Elliott Wave Pattern in CAD/JPY
The usual assumption is that the current uptrend will continue, although depending on various other observations and interpretation, conclusions ultimately may vary. Nonetheless, there is already some evidence that bullish momentum is in play for CADJPY.
While it is too late to enter at the bottom of the c wave (unless trading on the weekly time frame), a continuation trade may well be feasible. Even if price only retraces half of the A-B-C downward movement, there would be at least 250 pips of potential movement. For an hourly trade, that should be more than sufficient to provide good overall risk profile.
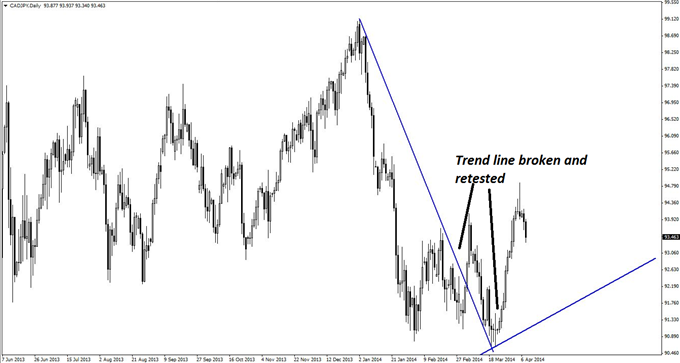
The daily chart below shows that a declining line of resistance has been broken and retested, and thus, the upward swing should have begun. As such, it is simply a matter of entering this move at a reasonable zone of support on the lower time frames.
Guest Commentary: New Daily Uptrend in CAD/JPY
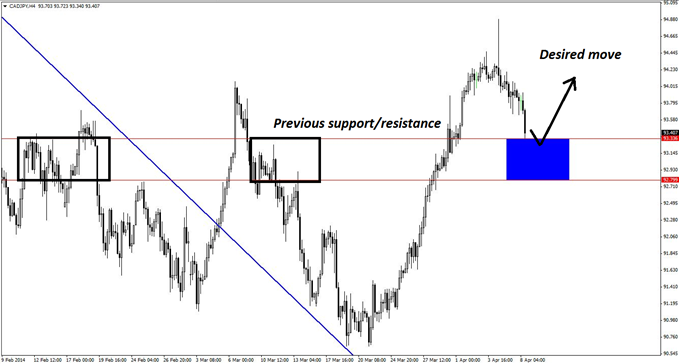
The support zone is somewhat more difficult to determine, but considering previous zones of support and resistance offers sufficient evidence that there is a cushion at 92.79-93.33. This zone is 54 pips deep, which more than satisfies the all-important risk parameters.
Guest Commentary: Key Support Zone for Buying CAD/JPY
Nonetheless, it would be wiser to take this trade on the hourly chart (not shown), where risk can be mitigated even more.
Viable trade triggers include the usual suspects: pin bars, bullish engulfing patterns, and/or bullish reversal divergence on the hourly chart of CADJPY. As always, two or three attempts may be necessary to get in on this set-up.
By Kaye Lee, private fund trader and head trader consultant, StraightTalkTrading.com
DailyFX provides forex news and technical analysis on the trends that influence the global currency markets.
Learn forex trading with a free practice account and trading charts from FXCM.


