Cahya Mata Sarawak Berhad (KLSE:CMSB) Shares Could Be 22% Above Their Intrinsic Value Estimate
Key Insights
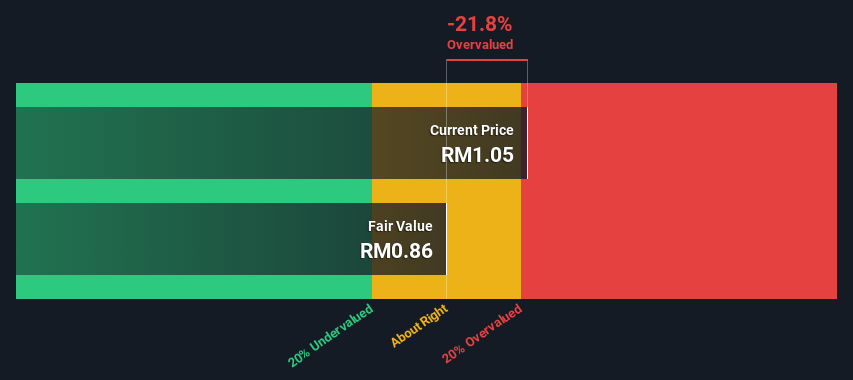
The projected fair value for Cahya Mata Sarawak Berhad is RM0.86 based on 2 Stage Free Cash Flow to Equity
Cahya Mata Sarawak Berhad is estimated to be 22% overvalued based on current share price of RM1.05
Our fair value estimate is 39% lower than Cahya Mata Sarawak Berhad's analyst price target of RM1.42
How far off is Cahya Mata Sarawak Berhad (KLSE:CMSB) from its intrinsic value? Using the most recent financial data, we'll take a look at whether the stock is fairly priced by taking the forecast future cash flows of the company and discounting them back to today's value. This will be done using the Discounted Cash Flow (DCF) model. It may sound complicated, but actually it is quite simple!
We generally believe that a company's value is the present value of all of the cash it will generate in the future. However, a DCF is just one valuation metric among many, and it is not without flaws. If you still have some burning questions about this type of valuation, take a look at the Simply Wall St analysis model.
See our latest analysis for Cahya Mata Sarawak Berhad
Is Cahya Mata Sarawak Berhad Fairly Valued?
We use what is known as a 2-stage model, which simply means we have two different periods of growth rates for the company's cash flows. Generally the first stage is higher growth, and the second stage is a lower growth phase. In the first stage we need to estimate the cash flows to the business over the next ten years. Where possible we use analyst estimates, but when these aren't available we extrapolate the previous free cash flow (FCF) from the last estimate or reported value. We assume companies with shrinking free cash flow will slow their rate of shrinkage, and that companies with growing free cash flow will see their growth rate slow, over this period. We do this to reflect that growth tends to slow more in the early years than it does in later years.
A DCF is all about the idea that a dollar in the future is less valuable than a dollar today, so we need to discount the sum of these future cash flows to arrive at a present value estimate:
10-year free cash flow (FCF) forecast
2024 | 2025 | 2026 | 2027 | 2028 | 2029 | 2030 | 2031 | 2032 | 2033 | |
Levered FCF (MYR, Millions) | -RM6.60m | RM16.9m | RM30.5m | RM48.0m | RM67.8m | RM88.2m | RM107.6m | RM125.4m | RM141.2m | RM155.2m |
Growth Rate Estimate Source | Analyst x1 | Analyst x1 | Est @ 80.51% | Est @ 57.43% | Est @ 41.27% | Est @ 29.96% | Est @ 22.04% | Est @ 16.50% | Est @ 12.62% | Est @ 9.91% |
Present Value (MYR, Millions) Discounted @ 12% | -RM5.9 | RM13.4 | RM21.6 | RM30.3 | RM38.1 | RM44.2 | RM48.0 | RM49.9 | RM50.1 | RM49.0 |
("Est" = FCF growth rate estimated by Simply Wall St)
Present Value of 10-year Cash Flow (PVCF) = RM339m
After calculating the present value of future cash flows in the initial 10-year period, we need to calculate the Terminal Value, which accounts for all future cash flows beyond the first stage. The Gordon Growth formula is used to calculate Terminal Value at a future annual growth rate equal to the 5-year average of the 10-year government bond yield of 3.6%. We discount the terminal cash flows to today's value at a cost of equity of 12%.
Terminal Value (TV)= FCF2033 × (1 + g) ÷ (r – g) = RM155m× (1 + 3.6%) ÷ (12%– 3.6%) = RM1.9b
Present Value of Terminal Value (PVTV)= TV / (1 + r)10= RM1.9b÷ ( 1 + 12%)10= RM588m
The total value is the sum of cash flows for the next ten years plus the discounted terminal value, which results in the Total Equity Value, which in this case is RM926m. In the final step we divide the equity value by the number of shares outstanding. Relative to the current share price of RM1.1, the company appears slightly overvalued at the time of writing. Valuations are imprecise instruments though, rather like a telescope - move a few degrees and end up in a different galaxy. Do keep this in mind.
The Assumptions
Now the most important inputs to a discounted cash flow are the discount rate, and of course, the actual cash flows. Part of investing is coming up with your own evaluation of a company's future performance, so try the calculation yourself and check your own assumptions. The DCF also does not consider the possible cyclicality of an industry, or a company's future capital requirements, so it does not give a full picture of a company's potential performance. Given that we are looking at Cahya Mata Sarawak Berhad as potential shareholders, the cost of equity is used as the discount rate, rather than the cost of capital (or weighted average cost of capital, WACC) which accounts for debt. In this calculation we've used 12%, which is based on a levered beta of 1.079. Beta is a measure of a stock's volatility, compared to the market as a whole. We get our beta from the industry average beta of globally comparable companies, with an imposed limit between 0.8 and 2.0, which is a reasonable range for a stable business.
SWOT Analysis for Cahya Mata Sarawak Berhad
Strength
Earnings growth over the past year exceeded the industry.
Debt is well covered by .
Weakness
Interest payments on debt are not well covered.
Dividend is low compared to the top 25% of dividend payers in the Basic Materials market.
Opportunity
Good value based on P/E ratio compared to estimated Fair P/E ratio.
Threat
Debt is not well covered by operating cash flow.
Paying a dividend but company has no free cash flows.
Annual earnings are forecast to decline for the next 3 years.
Looking Ahead:
Whilst important, the DCF calculation ideally won't be the sole piece of analysis you scrutinize for a company. It's not possible to obtain a foolproof valuation with a DCF model. Instead the best use for a DCF model is to test certain assumptions and theories to see if they would lead to the company being undervalued or overvalued. If a company grows at a different rate, or if its cost of equity or risk free rate changes sharply, the output can look very different. What is the reason for the share price exceeding the intrinsic value? For Cahya Mata Sarawak Berhad, we've put together three further aspects you should assess:
Risks: Be aware that Cahya Mata Sarawak Berhad is showing 3 warning signs in our investment analysis , and 1 of those is significant...
Future Earnings: How does CMSB's growth rate compare to its peers and the wider market? Dig deeper into the analyst consensus number for the upcoming years by interacting with our free analyst growth expectation chart.
Other High Quality Alternatives: Do you like a good all-rounder? Explore our interactive list of high quality stocks to get an idea of what else is out there you may be missing!
PS. The Simply Wall St app conducts a discounted cash flow valuation for every stock on the KLSE every day. If you want to find the calculation for other stocks just search here.
Have feedback on this article? Concerned about the content? Get in touch with us directly. Alternatively, email editorial-team (at) simplywallst.com.
This article by Simply Wall St is general in nature. We provide commentary based on historical data and analyst forecasts only using an unbiased methodology and our articles are not intended to be financial advice. It does not constitute a recommendation to buy or sell any stock, and does not take account of your objectives, or your financial situation. We aim to bring you long-term focused analysis driven by fundamental data. Note that our analysis may not factor in the latest price-sensitive company announcements or qualitative material. Simply Wall St has no position in any stocks mentioned.
Join A Paid User Research Session
You’ll receive a US$30 Amazon Gift card for 1 hour of your time while helping us build better investing tools for the individual investors like yourself. Sign up here
