Calamos Strategic Total Return Fund's Dividend Analysis
An In-depth Look at CSQ's Dividend Performance and Sustainability
Calamos Strategic Total Return Fund (NASDAQ:CSQ) recently announced a dividend of $0.1 per share, payable on 2023-10-19, with the ex-dividend date set for 2023-10-12. As investors look forward to this upcoming payment, the spotlight also shines on the company's dividend history, yield, and growth rates. Using the data from GuruFocus, let's look into Calamos Strategic Total Return Fund's dividend performance and assess its sustainability.
What Does Calamos Strategic Total Return Fund Do?
Warning! GuruFocus has detected 3 Warning Sign with NZF. Click here to check it out.
This Powerful Chart Made Peter Lynch 29% A Year For 13 Years
How to calculate the intrinsic value of a stock?
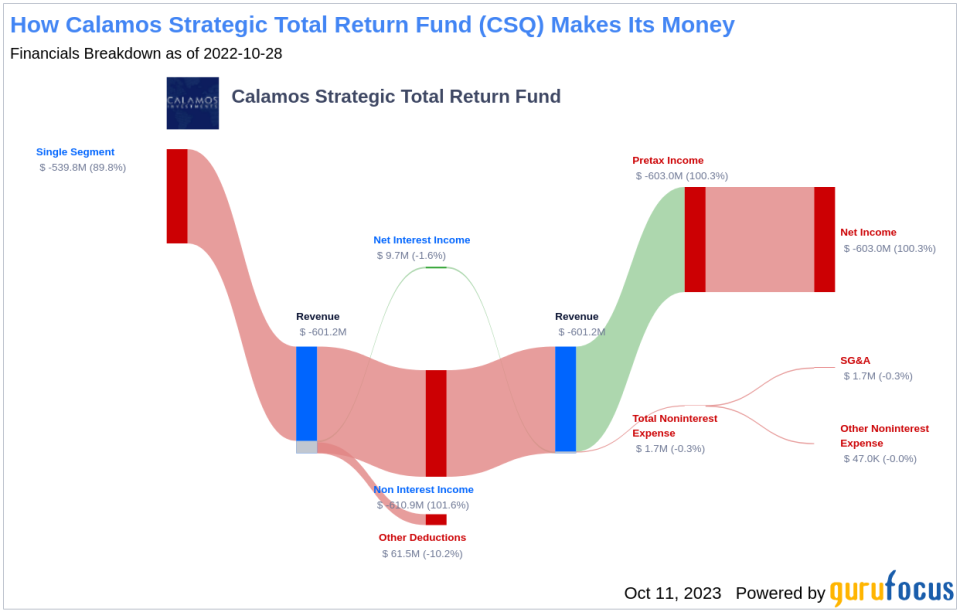
Calamos Strategic Total Return Fund is a diversified, closed-end management investment company. The fund's investment strategy is to provide total return through a combination of capital appreciation and current income. Its fund includes Hedged Equity Income, Market Neutral Income, and others.
A Glimpse at Calamos Strategic Total Return Fund's Dividend History
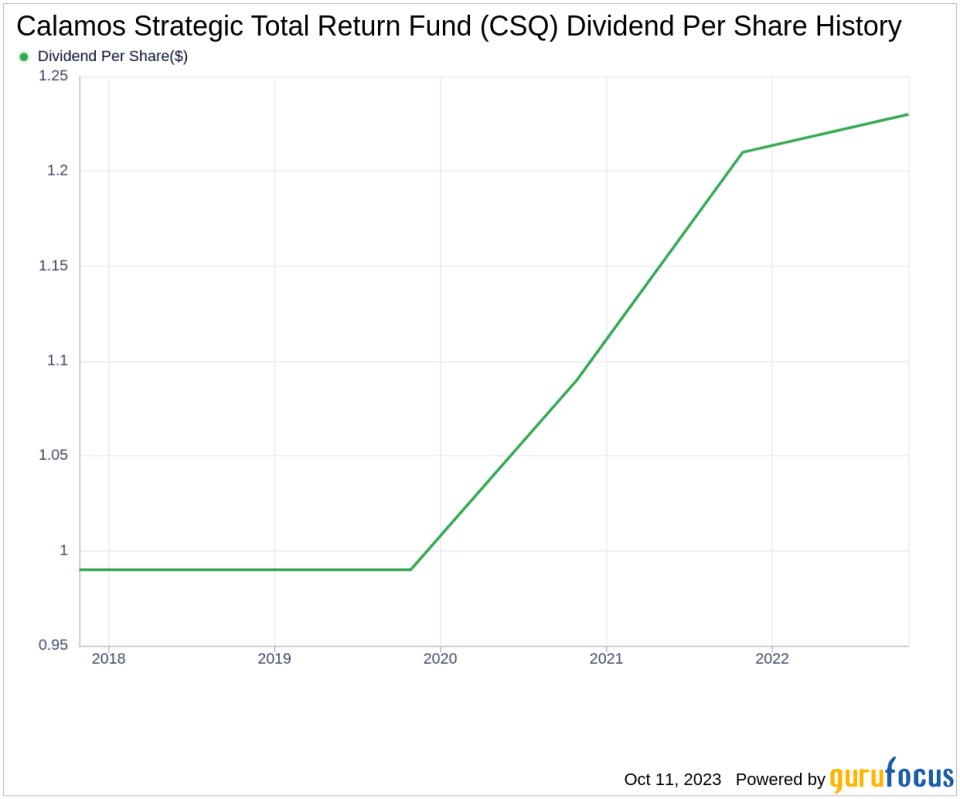
Calamos Strategic Total Return Fund has maintained a consistent dividend payment record since 2004. Dividends are currently distributed on a monthly basis. Below is a chart showing annual Dividends Per Share for tracking historical trends.
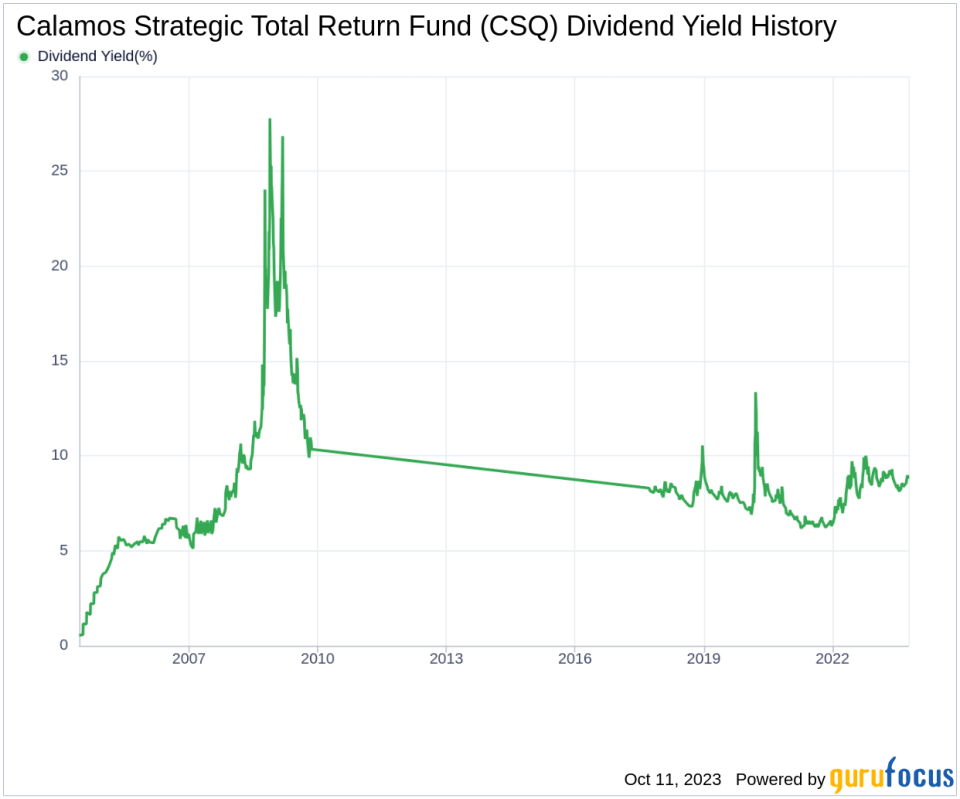
Breaking Down Calamos Strategic Total Return Fund's Dividend Yield and Growth
As of today, Calamos Strategic Total Return Fund currently has a 12-month trailing dividend yield of 8.82% and a 12-month forward dividend yield of 8.82%. This suggests an expectation of same dividend payments over the next 12 months.
Over the past three years, Calamos Strategic Total Return Fund's annual dividend growth rate was 7.50%. Extended to a five-year horizon, this rate decreased to 5.20% per year.
Based on Calamos Strategic Total Return Fund's dividend yield and five-year growth rate, the 5-year yield on cost of Calamos Strategic Total Return Fund stock as of today is approximately 11.36%.
The Sustainability Question: Payout Ratio and Profitability
To assess the sustainability of the dividend, one needs to evaluate the company's payout ratio. The dividend payout ratio provides insights into the portion of earnings the company distributes as dividends. A lower ratio suggests that the company retains a significant part of its earnings, thereby ensuring the availability of funds for future growth and unexpected downturns. As of 2023-04-30, Calamos Strategic Total Return Fund's dividend payout ratio is 0.00.
Calamos Strategic Total Return Fund's profitability rank, offers an understanding of the company's earnings prowess relative to its peers. GuruFocus ranks Calamos Strategic Total Return Fund's profitability 2 out of 10 as of 2023-04-30, suggesting the dividend may not be sustainable. The company has reported net profit in 5 years out of past 10 years.
Growth Metrics: The Future Outlook
To ensure the sustainability of dividends, a company must have robust growth metrics. Calamos Strategic Total Return Fund's growth rank of 2 out of 10 suggests that the company has poor growth prospects and thus, the dividend may not be sustainable.
Next Steps
In conclusion, while Calamos Strategic Total Return Fund has a history of consistent dividend payments and a high current yield, its low profitability and growth ranks raise questions about the sustainability of its dividend in the long term. Investors should consider these factors when making decisions about their portfolio.
GuruFocus Premium users can screen for high-dividend yield stocks using the High Dividend Yield Screener.
This article, generated by GuruFocus, is designed to provide general insights and is not tailored financial advice. Our commentary is rooted in historical data and analyst projections, utilizing an impartial methodology, and is not intended to serve as specific investment guidance. It does not formulate a recommendation to purchase or divest any stock and does not consider individual investment objectives or financial circumstances. Our objective is to deliver long-term, fundamental data-driven analysis. Be aware that our analysis might not incorporate the most recent, price-sensitive company announcements or qualitative information. GuruFocus holds no position in the stocks mentioned herein.
This article first appeared on GuruFocus.
