Calculating The Fair Value Of NAHL Group Plc (LON:NAH)
Key Insights
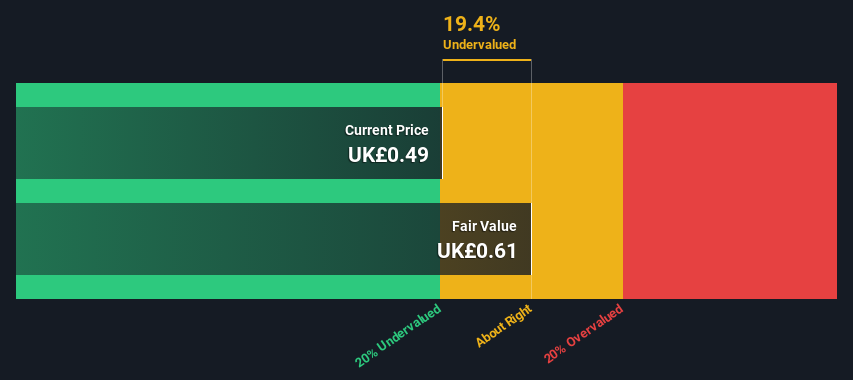
The projected fair value for NAHL Group is UK£0.61 based on 2 Stage Free Cash Flow to Equity
NAHL Group's UK£0.49 share price indicates it is trading at similar levels as its fair value estimate
When compared to theindustry average discount to fair value of 32%, NAHL Group's competitors seem to be trading at a greater discount
How far off is NAHL Group Plc (LON:NAH) from its intrinsic value? Using the most recent financial data, we'll take a look at whether the stock is fairly priced by taking the expected future cash flows and discounting them to their present value. One way to achieve this is by employing the Discounted Cash Flow (DCF) model. Models like these may appear beyond the comprehension of a lay person, but they're fairly easy to follow.
Companies can be valued in a lot of ways, so we would point out that a DCF is not perfect for every situation. If you still have some burning questions about this type of valuation, take a look at the Simply Wall St analysis model.
See our latest analysis for NAHL Group
The Model
We're using the 2-stage growth model, which simply means we take in account two stages of company's growth. In the initial period the company may have a higher growth rate and the second stage is usually assumed to have a stable growth rate. In the first stage we need to estimate the cash flows to the business over the next ten years. Seeing as no analyst estimates of free cash flow are available to us, we have extrapolate the previous free cash flow (FCF) from the company's last reported value. We assume companies with shrinking free cash flow will slow their rate of shrinkage, and that companies with growing free cash flow will see their growth rate slow, over this period. We do this to reflect that growth tends to slow more in the early years than it does in later years.
Generally we assume that a dollar today is more valuable than a dollar in the future, so we need to discount the sum of these future cash flows to arrive at a present value estimate:
10-year free cash flow (FCF) estimate
2024 | 2025 | 2026 | 2027 | 2028 | 2029 | 2030 | 2031 | 2032 | 2033 | |
Levered FCF (£, Millions) | UK£3.95m | UK£3.25m | UK£2.86m | UK£2.63m | UK£2.49m | UK£2.41m | UK£2.36m | UK£2.34m | UK£2.33m | UK£2.34m |
Growth Rate Estimate Source | Est @ -25.81% | Est @ -17.69% | Est @ -12.01% | Est @ -8.04% | Est @ -5.25% | Est @ -3.31% | Est @ -1.94% | Est @ -0.99% | Est @ -0.32% | Est @ 0.15% |
Present Value (£, Millions) Discounted @ 9.6% | UK£3.6 | UK£2.7 | UK£2.2 | UK£1.8 | UK£1.6 | UK£1.4 | UK£1.2 | UK£1.1 | UK£1.0 | UK£0.9 |
("Est" = FCF growth rate estimated by Simply Wall St)
Present Value of 10-year Cash Flow (PVCF) = UK£18m
After calculating the present value of future cash flows in the initial 10-year period, we need to calculate the Terminal Value, which accounts for all future cash flows beyond the first stage. The Gordon Growth formula is used to calculate Terminal Value at a future annual growth rate equal to the 5-year average of the 10-year government bond yield of 1.2%. We discount the terminal cash flows to today's value at a cost of equity of 9.6%.
Terminal Value (TV)= FCF2033 × (1 + g) ÷ (r – g) = UK£2.3m× (1 + 1.2%) ÷ (9.6%– 1.2%) = UK£28m
Present Value of Terminal Value (PVTV)= TV / (1 + r)10= UK£28m÷ ( 1 + 9.6%)10= UK£11m
The total value, or equity value, is then the sum of the present value of the future cash flows, which in this case is UK£29m. To get the intrinsic value per share, we divide this by the total number of shares outstanding. Relative to the current share price of UK£0.5, the company appears about fair value at a 19% discount to where the stock price trades currently. Remember though, that this is just an approximate valuation, and like any complex formula - garbage in, garbage out.
Important Assumptions
Now the most important inputs to a discounted cash flow are the discount rate, and of course, the actual cash flows. You don't have to agree with these inputs, I recommend redoing the calculations yourself and playing with them. The DCF also does not consider the possible cyclicality of an industry, or a company's future capital requirements, so it does not give a full picture of a company's potential performance. Given that we are looking at NAHL Group as potential shareholders, the cost of equity is used as the discount rate, rather than the cost of capital (or weighted average cost of capital, WACC) which accounts for debt. In this calculation we've used 9.6%, which is based on a levered beta of 1.205. Beta is a measure of a stock's volatility, compared to the market as a whole. We get our beta from the industry average beta of globally comparable companies, with an imposed limit between 0.8 and 2.0, which is a reasonable range for a stable business.
Moving On:
Whilst important, the DCF calculation is only one of many factors that you need to assess for a company. The DCF model is not a perfect stock valuation tool. Preferably you'd apply different cases and assumptions and see how they would impact the company's valuation. For example, changes in the company's cost of equity or the risk free rate can significantly impact the valuation. For NAHL Group, there are three essential elements you should further examine:
Risks: Consider for instance, the ever-present spectre of investment risk. We've identified 3 warning signs with NAHL Group (at least 1 which makes us a bit uncomfortable) , and understanding them should be part of your investment process.
Management:Have insiders been ramping up their shares to take advantage of the market's sentiment for NAH's future outlook? Check out our management and board analysis with insights on CEO compensation and governance factors.
Other Solid Businesses: Low debt, high returns on equity and good past performance are fundamental to a strong business. Why not explore our interactive list of stocks with solid business fundamentals to see if there are other companies you may not have considered!
PS. Simply Wall St updates its DCF calculation for every British stock every day, so if you want to find the intrinsic value of any other stock just search here.
Have feedback on this article? Concerned about the content? Get in touch with us directly. Alternatively, email editorial-team (at) simplywallst.com.
This article by Simply Wall St is general in nature. We provide commentary based on historical data and analyst forecasts only using an unbiased methodology and our articles are not intended to be financial advice. It does not constitute a recommendation to buy or sell any stock, and does not take account of your objectives, or your financial situation. We aim to bring you long-term focused analysis driven by fundamental data. Note that our analysis may not factor in the latest price-sensitive company announcements or qualitative material. Simply Wall St has no position in any stocks mentioned.
Join A Paid User Research Session
You’ll receive a US$30 Amazon Gift card for 1 hour of your time while helping us build better investing tools for the individual investors like yourself. Sign up here
