Calculating The Intrinsic Value Of Andrews Sykes Group plc (LON:ASY)
Key Insights
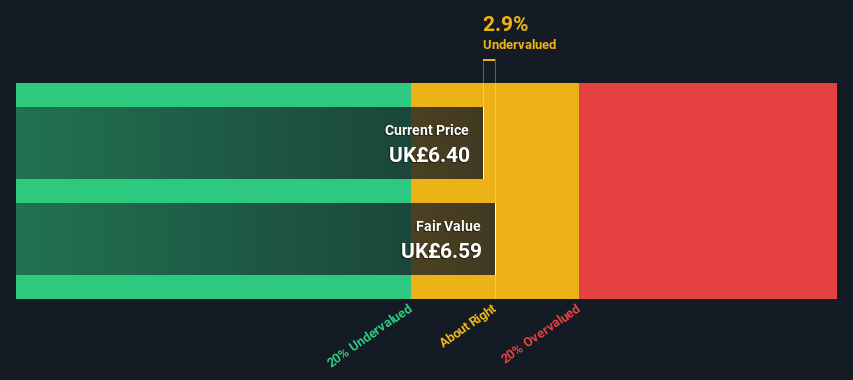
Andrews Sykes Group's estimated fair value is UK£6.59 based on 2 Stage Free Cash Flow to Equity
Andrews Sykes Group's UK£6.40 share price indicates it is trading at similar levels as its fair value estimate
The average premium for Andrews Sykes Group's competitorsis currently 8.6%
In this article we are going to estimate the intrinsic value of Andrews Sykes Group plc (LON:ASY) by taking the expected future cash flows and discounting them to their present value. The Discounted Cash Flow (DCF) model is the tool we will apply to do this. There's really not all that much to it, even though it might appear quite complex.
We generally believe that a company's value is the present value of all of the cash it will generate in the future. However, a DCF is just one valuation metric among many, and it is not without flaws. If you still have some burning questions about this type of valuation, take a look at the Simply Wall St analysis model.
Check out our latest analysis for Andrews Sykes Group
Is Andrews Sykes Group Fairly Valued?
We are going to use a two-stage DCF model, which, as the name states, takes into account two stages of growth. The first stage is generally a higher growth period which levels off heading towards the terminal value, captured in the second 'steady growth' period. In the first stage we need to estimate the cash flows to the business over the next ten years. Seeing as no analyst estimates of free cash flow are available to us, we have extrapolate the previous free cash flow (FCF) from the company's last reported value. We assume companies with shrinking free cash flow will slow their rate of shrinkage, and that companies with growing free cash flow will see their growth rate slow, over this period. We do this to reflect that growth tends to slow more in the early years than it does in later years.
Generally we assume that a dollar today is more valuable than a dollar in the future, and so the sum of these future cash flows is then discounted to today's value:
10-year free cash flow (FCF) estimate
2024 | 2025 | 2026 | 2027 | 2028 | 2029 | 2030 | 2031 | 2032 | 2033 | |
Levered FCF (£, Millions) | UK£20.2m | UK£19.4m | UK£18.9m | UK£18.7m | UK£18.6m | UK£18.6m | UK£18.7m | UK£18.8m | UK£19.0m | UK£19.2m |
Growth Rate Estimate Source | Est @ -6.50% | Est @ -4.14% | Est @ -2.48% | Est @ -1.32% | Est @ -0.51% | Est @ 0.06% | Est @ 0.45% | Est @ 0.73% | Est @ 0.93% | Est @ 1.06% |
Present Value (£, Millions) Discounted @ 7.7% | UK£18.8 | UK£16.7 | UK£15.2 | UK£13.9 | UK£12.8 | UK£11.9 | UK£11.1 | UK£10.4 | UK£9.8 | UK£9.2 |
("Est" = FCF growth rate estimated by Simply Wall St)
Present Value of 10-year Cash Flow (PVCF) = UK£130m
We now need to calculate the Terminal Value, which accounts for all the future cash flows after this ten year period. The Gordon Growth formula is used to calculate Terminal Value at a future annual growth rate equal to the 5-year average of the 10-year government bond yield of 1.4%. We discount the terminal cash flows to today's value at a cost of equity of 7.7%.
Terminal Value (TV)= FCF2033 × (1 + g) ÷ (r – g) = UK£19m× (1 + 1.4%) ÷ (7.7%– 1.4%) = UK£309m
Present Value of Terminal Value (PVTV)= TV / (1 + r)10= UK£309m÷ ( 1 + 7.7%)10= UK£147m
The total value, or equity value, is then the sum of the present value of the future cash flows, which in this case is UK£277m. The last step is to then divide the equity value by the number of shares outstanding. Relative to the current share price of UK£6.4, the company appears about fair value at a 2.9% discount to where the stock price trades currently. Remember though, that this is just an approximate valuation, and like any complex formula - garbage in, garbage out.
The Assumptions
Now the most important inputs to a discounted cash flow are the discount rate, and of course, the actual cash flows. Part of investing is coming up with your own evaluation of a company's future performance, so try the calculation yourself and check your own assumptions. The DCF also does not consider the possible cyclicality of an industry, or a company's future capital requirements, so it does not give a full picture of a company's potential performance. Given that we are looking at Andrews Sykes Group as potential shareholders, the cost of equity is used as the discount rate, rather than the cost of capital (or weighted average cost of capital, WACC) which accounts for debt. In this calculation we've used 7.7%, which is based on a levered beta of 1.066. Beta is a measure of a stock's volatility, compared to the market as a whole. We get our beta from the industry average beta of globally comparable companies, with an imposed limit between 0.8 and 2.0, which is a reasonable range for a stable business.
SWOT Analysis for Andrews Sykes Group
Strength
Earnings growth over the past year exceeded the industry.
Currently debt free.
Dividends are covered by earnings and cash flows.
Weakness
Dividend is low compared to the top 25% of dividend payers in the Trade Distributors market.
Opportunity
Current share price is below our estimate of fair value.
Lack of analyst coverage makes it difficult to determine ASY's earnings prospects.
Threat
No apparent threats visible for ASY.
Moving On:
Whilst important, the DCF calculation shouldn't be the only metric you look at when researching a company. The DCF model is not a perfect stock valuation tool. Rather it should be seen as a guide to "what assumptions need to be true for this stock to be under/overvalued?" If a company grows at a different rate, or if its cost of equity or risk free rate changes sharply, the output can look very different. For Andrews Sykes Group, we've put together three essential factors you should consider:
Risks: For instance, we've identified 1 warning sign for Andrews Sykes Group that you should be aware of.
Other Solid Businesses: Low debt, high returns on equity and good past performance are fundamental to a strong business. Why not explore our interactive list of stocks with solid business fundamentals to see if there are other companies you may not have considered!
Other Top Analyst Picks: Interested to see what the analysts are thinking? Take a look at our interactive list of analysts' top stock picks to find out what they feel might have an attractive future outlook!
PS. Simply Wall St updates its DCF calculation for every British stock every day, so if you want to find the intrinsic value of any other stock just search here.
Have feedback on this article? Concerned about the content? Get in touch with us directly. Alternatively, email editorial-team (at) simplywallst.com.
This article by Simply Wall St is general in nature. We provide commentary based on historical data and analyst forecasts only using an unbiased methodology and our articles are not intended to be financial advice. It does not constitute a recommendation to buy or sell any stock, and does not take account of your objectives, or your financial situation. We aim to bring you long-term focused analysis driven by fundamental data. Note that our analysis may not factor in the latest price-sensitive company announcements or qualitative material. Simply Wall St has no position in any stocks mentioned.
