Calculating the Intrinsic Value for Lucid Group, Inc.'s (NASDAQ:LCID)
This article was originally published on Simply Wall St News
Lucid Group, Inc. ( NASDAQ:LCID ), is a young growth company that aims to take on the luxury EV market worldwide. The company is well-funded, and nearing the start of production of their first vehicle models, the "Lucid Air". Because it is in such an early stage, there are seldom good estimates of what the company is worth. We are going to take the expected fundamental performance for the company and build a simple discounted cash flow model (valuation), in order to help investors get more clarity on what kind of performance they need to expect from management if they want the stock price to converge with the value of Lucid.
Our model is rough and represents an array of subjective estimates to come up with the end result. However, it can be beneficial to investors to get a feeling of what the business might be worth today.
View our latest analysis for Lucid Group
We are currently going to set the start date of the valuation today, and estimate the first revenues as they would appear at the end of 2022.
The maximum expected capacity is 53,000 vehicles per year in 2023 - which should give us an initial cap on revenues.
The total addressable market for luxury vehicles is estimated to be US$733b by 2026. Because our valuation goes on to 2031, we will extend and round up this number to US$800b.
Some 5% of that is expected to be captured by EV globally - This is our category and gives a maximum market share of $800b * 5% = $40b.
With this estimate, we are attempting to see how big is the piece of the pie that Lucid will compete for. It seems that Lucid will have models for varying degree of luxury, so their potential target customer may also encompass regular or "sports" car enthusiasts.
Revenue Estimates
For the initial revenue numbers, we will rely somewhat on the reservation numbers and compute an estimate for first year revenues.
The company had more than 10,000 reservations by the end of July 2021. We can assume some change in sentiment and estimate that reservations will go up to 15,000 by the end of 2021.
This is our first year revenue projection: 15,000 * US$76,000 = US$760m for 2022
With this, we are implying that most of the sales will pertain to their base model.
The first year will be pivotal. Customers will come back with reviews, drive vlogs, word of mouth and this will ultimately affect the hello effect for the company. If Lucid excels in the branding for their first year, we will be more comfortable attributing larger growth rates and selling at capacity.
This is a generous number and is more than Tesla ( NASDAQ:TSLA ) made at the end of 2012. However, we can assume that Lucid has some experience, which tesla lacked when pioneering EV production.
Simply Wall St also reports global analyst estimates on our platform, and their projection is US$1.73b for the end of 2022. This is a bit on the optimistic side for first year sales, so in our valuation we will go with the initial estimate.
Revenue Growth
For the initial years of a young growth company, it is not rare to see growth rates of 50%+, as the company is tapping into their target market. Instead of getting lost in the initial growth numbers, we can take an inverse approach: we can look at the total addressable market, and estimate a market share for Lucid at year 10. Then we work back on the growth rates in between.
If the addressable market for luxury EVs is about US$40b as we noted initially, we have 3 options: assume that Lucid becomes a market leader and attribute 40-50% share, estimate that a competitor is the market leader and Lucid is a secondary power with 20-30%, or we can see Lucid as targeting a niche audience and manages to sell to about 5-10% of the TAM.
Because Lucid is entering a new market, and they are relatively unknown in the world, we can say that the company will need to spend a significant portion of funds for building their brand name, besides the CapEx for production.
For this reason, we will not give them the market leader share for the first ten years and will give them the upper share as a secondary power - This leads to a market share of 30% at the end of the 10-year period, which amounts to: US$40b * 0.3 = US$12b in revenues at the end of the 10-year period.
Consequently, Lucid will have to triple their 2022 production capacity in order to support this number, which means continuous CapEx investments.
Profit Margin Estimates
To get a better understanding of how profitable a company like this can be, we list out the margins for most auto manufacturers in 2019 (2020 was an unusual year), and after examining, we can estimate where Lucid fits in this list.
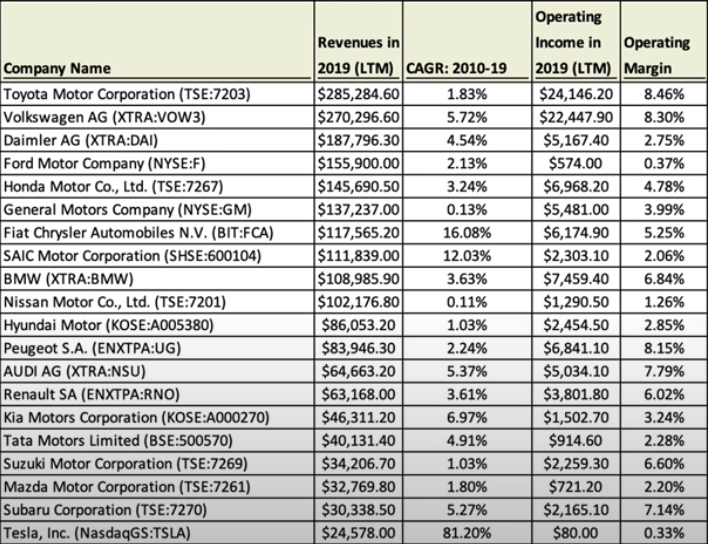
When we examine the operating margins for different companies in 2019, it strikes us that Lucid will converge on margins similar to BMW ( XTRA:BMW ). We can also estimate that EV production will be more efficient than traditional auto production and can give a 2% boost to operating margins.
This leaves us with an estimated operating margin of 8.8% that will converge at year 10.
Risk Metrics
Lucid is initially going to target the US Market, this will give us a hint as to the risk measure to use in the cost of capital. Entry to European and Middle Eastern markets is expected to begin by 2022. Given that we do not know which target audience will prefer Lucid more, we will split the risk into roughly 3 equal parts, with US 35%, Europe 32.5% and the Middle East 32.5%.
This gives us a cost of capital of 6.7%.
Considering that this is a young growth company, with a multitude of unknowns, we must estimate the failure risk in the next 10 years. A project like this can be shut down for many reasons, including: lack of funding, competitive pressure, underwhelming customer uptake, safety standard failures, patent and other litigation.
With all this in mind, we attach a 10% failure probability during the 10-year period, which is characteristic for young companies.
Finalizing the Valuation
The company has a Net Loss of US$3.6b to date, which we will put in a provision to shield them from future taxes until they become profitable.
The tax rate starts from 0% as Lucid is currently unprofitable, and we estimate a convergence to 8%. The reasoning behind this is that there will be many subsidies and credits for EV companies in the future, and we see Lucid tapping into that - Which is why we don't ascribe them the 27% marginal tax rate.
Reinvestment is a key component in an asset heavy business. We will be very optimistic here, and estimate that for every $1 invested in operations (CapEx, Sales, Marketing, Research, Design, Production, Supply Chain, etc...) the company will see a 2.5x revenue return. This implies both that management is superb at their job, and that consumers love the product and sales grow organically at a high rate. With our estimates, during the 10-year period, the company will have re-invested some $4.9b back into operations.
Result
With all of these assumptions in mid, and our estimates that are based on the company presentation , we see the company potentially having this intrinsic value:
Present Value of Free Cash Flows to the Firm (10yr model): US$-845.9m
Present Value of Terminal Value: US$9.9b
Intrinsic Value of Equity in Common Stock: US$9.2b / $5.6 per share
Current Market Capitalization: US$40.9b / $25.5 per share
Overvalued by 345%
We can see the income projections for the next 10 years in the chart below:
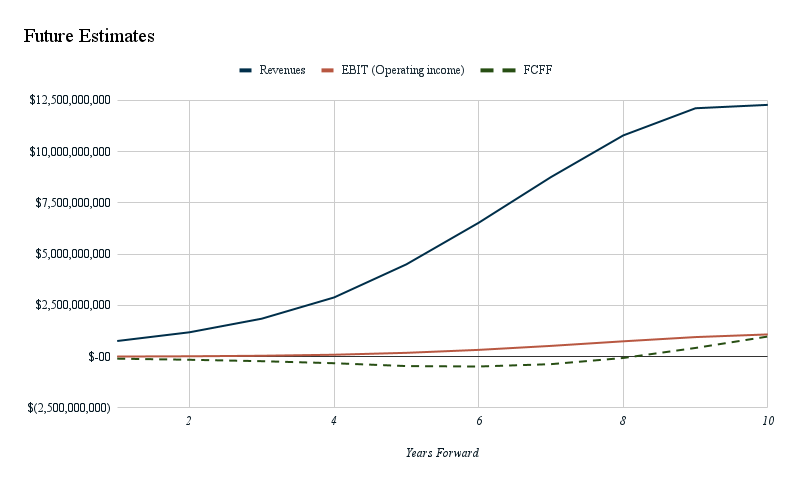
As we can see, by using our rough model for Free Cash Flows to the Firm DCF, we come up with a value of equity of US$9.2b . This shouldn't be too surprising as the company is involved in a capital intense business and is relatively young. The intrinsic value will keep rising as Lucid expands sales and operations.
There are many things that are flawed with a DCF approach, and different analysts will almost always come up with different estimates , but if we want to test out a few variants, we can hold everything constant and just change the projected revenues in order to see how the company value changes.
This is a form of sensitivity analysis and will help investors see what the intrinsic value is for different rates of success:
Variant A: With end revenues of US$25b, we get an intrinsic value of US$18b, (128% overvalued)
Variant B: With end revenues of US$40b, we get an intrinsic value of US$27b, (48% overvalued)
Variant C: With end revenues of US$60b, we get an intrinsic value of US$43b, (4% undervalued)
Alternatively we can also assume a higher profitability to reflect the luxury market, and instead of 8.8% EBIT margin we can test out 10% and 12% margins ( keep in mind that this is quite optimistic ).
Variant A1: With end revenues of US$25b & 10% EBIT margin, we get an intrinsic value of US$21b, (94% overvalued)
Variant A2: With end revenues of US$25b & 12% EBIT margin, we get an intrinsic value of US$26.7b, (54% overvalued)
Variant B1: With end revenues of US$40b & 10% EBIT margin, we get an intrinsic value of US$33b, (24% overvalued)
Variant B2: With end revenues of US$40b & 12% EBIT margin, we get an intrinsic value of US$41.9b, (1% undervalued)
The last variant is effectively what management is promising shareholders.
Hopefully, this gives investors some clarity as to how much performance they need from management in order to justify current prices. Anything above, should be indicative of future upside on the stock.
NB: Figures in this article are calculated using data from the last twelve months, which refer to the 12-month period ending on the last date of the month the financial statement is dated. This may not be consistent with full year annual report figures.
Simply Wall St analyst Goran Damchevski and Simply Wall St have no position in any of the companies mentioned. This article is general in nature. We provide commentary based on historical data and analyst forecasts only using an unbiased methodology and our articles are not intended to be financial advice. It does not constitute a recommendation to buy or sell any stock and does not take account of your objectives, or your financial situation. We aim to bring you long-term focused analysis driven by fundamental data. Note that our analysis may not factor in the latest price-sensitive company announcements or qualitative material.
Have feedback on this article? Concerned about the content? Get in touch with us directly. Alternatively, email editorial-team@simplywallst.com
