Calculating The Intrinsic Value Of MediaZest plc (LON:MDZ)
Key Insights
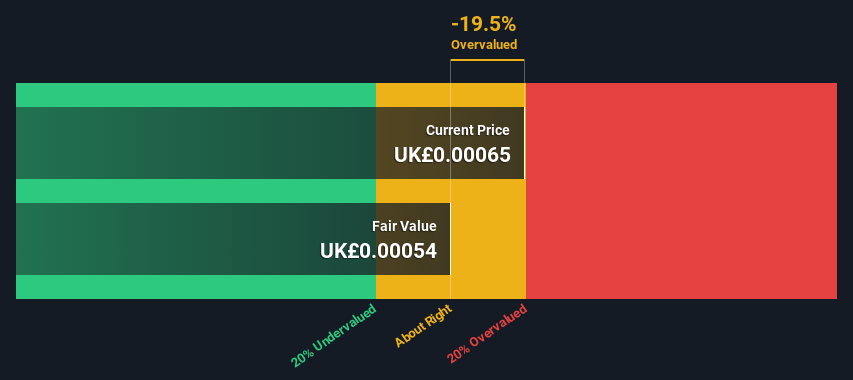
MediaZest's estimated fair value is UK£0.00054 based on 2 Stage Free Cash Flow to Equity
Current share price of UK£0.00065 suggests MediaZest is potentially trading close to its fair value
The average discount for MediaZest's competitorsis currently 45%
Does the March share price for MediaZest plc (LON:MDZ) reflect what it's really worth? Today, we will estimate the stock's intrinsic value by taking the forecast future cash flows of the company and discounting them back to today's value. One way to achieve this is by employing the Discounted Cash Flow (DCF) model. Models like these may appear beyond the comprehension of a lay person, but they're fairly easy to follow.
We generally believe that a company's value is the present value of all of the cash it will generate in the future. However, a DCF is just one valuation metric among many, and it is not without flaws. For those who are keen learners of equity analysis, the Simply Wall St analysis model here may be something of interest to you.
View our latest analysis for MediaZest
The Method
We use what is known as a 2-stage model, which simply means we have two different periods of growth rates for the company's cash flows. Generally the first stage is higher growth, and the second stage is a lower growth phase. To start off with, we need to estimate the next ten years of cash flows. Seeing as no analyst estimates of free cash flow are available to us, we have extrapolate the previous free cash flow (FCF) from the company's last reported value. We assume companies with shrinking free cash flow will slow their rate of shrinkage, and that companies with growing free cash flow will see their growth rate slow, over this period. We do this to reflect that growth tends to slow more in the early years than it does in later years.
A DCF is all about the idea that a dollar in the future is less valuable than a dollar today, so we need to discount the sum of these future cash flows to arrive at a present value estimate:
10-year free cash flow (FCF) estimate
2024 | 2025 | 2026 | 2027 | 2028 | 2029 | 2030 | 2031 | 2032 | 2033 | |
Levered FCF (£, Millions) | UK£105.2k | UK£90.0k | UK£81.4k | UK£76.3k | UK£73.4k | UK£71.8k | UK£71.0k | UK£70.8k | UK£71.0k | UK£71.6k |
Growth Rate Estimate Source | Est @ -21.28% | Est @ -14.40% | Est @ -9.59% | Est @ -6.22% | Est @ -3.86% | Est @ -2.21% | Est @ -1.06% | Est @ -0.25% | Est @ 0.32% | Est @ 0.72% |
Present Value (£, Millions) Discounted @ 9.1% | UK£0.1 | UK£0.08 | UK£0.06 | UK£0.05 | UK£0.05 | UK£0.04 | UK£0.04 | UK£0.04 | UK£0.03 | UK£0.03 |
("Est" = FCF growth rate estimated by Simply Wall St)
Present Value of 10-year Cash Flow (PVCF) = UK£515k
The second stage is also known as Terminal Value, this is the business's cash flow after the first stage. For a number of reasons a very conservative growth rate is used that cannot exceed that of a country's GDP growth. In this case we have used the 5-year average of the 10-year government bond yield (1.6%) to estimate future growth. In the same way as with the 10-year 'growth' period, we discount future cash flows to today's value, using a cost of equity of 9.1%.
Terminal Value (TV)= FCF2033 × (1 + g) ÷ (r – g) = UK£72k× (1 + 1.6%) ÷ (9.1%– 1.6%) = UK£975k
Present Value of Terminal Value (PVTV)= TV / (1 + r)10= UK£975k÷ ( 1 + 9.1%)10= UK£408k
The total value, or equity value, is then the sum of the present value of the future cash flows, which in this case is UK£923k. The last step is to then divide the equity value by the number of shares outstanding. Compared to the current share price of UK£0.0006, the company appears around fair value at the time of writing. Remember though, that this is just an approximate valuation, and like any complex formula - garbage in, garbage out.
The Assumptions
Now the most important inputs to a discounted cash flow are the discount rate, and of course, the actual cash flows. Part of investing is coming up with your own evaluation of a company's future performance, so try the calculation yourself and check your own assumptions. The DCF also does not consider the possible cyclicality of an industry, or a company's future capital requirements, so it does not give a full picture of a company's potential performance. Given that we are looking at MediaZest as potential shareholders, the cost of equity is used as the discount rate, rather than the cost of capital (or weighted average cost of capital, WACC) which accounts for debt. In this calculation we've used 9.1%, which is based on a levered beta of 1.362. Beta is a measure of a stock's volatility, compared to the market as a whole. We get our beta from the industry average beta of globally comparable companies, with an imposed limit between 0.8 and 2.0, which is a reasonable range for a stable business.
SWOT Analysis for MediaZest
Strength
No major strengths identified for MDZ.
Weakness
Current share price is above our estimate of fair value.
Shareholders have been diluted in the past year.
Opportunity
Has sufficient cash runway for more than 3 years based on current free cash flows.
Lack of analyst coverage makes it difficult to determine MDZ's earnings prospects.
Threat
Debt is not well covered by operating cash flow.
Moving On:
Valuation is only one side of the coin in terms of building your investment thesis, and it ideally won't be the sole piece of analysis you scrutinize for a company. It's not possible to obtain a foolproof valuation with a DCF model. Rather it should be seen as a guide to "what assumptions need to be true for this stock to be under/overvalued?" For instance, if the terminal value growth rate is adjusted slightly, it can dramatically alter the overall result. For MediaZest, there are three important aspects you should consider:
Risks: Case in point, we've spotted 5 warning signs for MediaZest you should be aware of, and 2 of them don't sit too well with us.
Other High Quality Alternatives: Do you like a good all-rounder? Explore our interactive list of high quality stocks to get an idea of what else is out there you may be missing!
Other Top Analyst Picks: Interested to see what the analysts are thinking? Take a look at our interactive list of analysts' top stock picks to find out what they feel might have an attractive future outlook!
PS. Simply Wall St updates its DCF calculation for every British stock every day, so if you want to find the intrinsic value of any other stock just search here.
Have feedback on this article? Concerned about the content? Get in touch with us directly. Alternatively, email editorial-team (at) simplywallst.com.
This article by Simply Wall St is general in nature. We provide commentary based on historical data and analyst forecasts only using an unbiased methodology and our articles are not intended to be financial advice. It does not constitute a recommendation to buy or sell any stock, and does not take account of your objectives, or your financial situation. We aim to bring you long-term focused analysis driven by fundamental data. Note that our analysis may not factor in the latest price-sensitive company announcements or qualitative material. Simply Wall St has no position in any stocks mentioned.
