Calculating The Intrinsic Value Of MMA Offshore Limited (ASX:MRM)
Key Insights
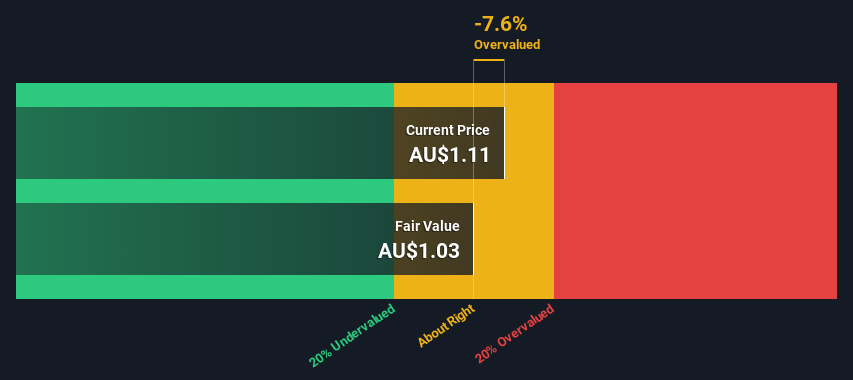
The projected fair value for MMA Offshore is AU$1.03 based on 2 Stage Free Cash Flow to Equity
Current share price of AU$1.11 suggests MMA Offshore is potentially trading close to its fair value
MMA Offshore's peers seem to be trading at a higher premium to fair value based onthe industry average of -104%
In this article we are going to estimate the intrinsic value of MMA Offshore Limited (ASX:MRM) by taking the forecast future cash flows of the company and discounting them back to today's value. One way to achieve this is by employing the Discounted Cash Flow (DCF) model. Don't get put off by the jargon, the math behind it is actually quite straightforward.
We would caution that there are many ways of valuing a company and, like the DCF, each technique has advantages and disadvantages in certain scenarios. For those who are keen learners of equity analysis, the Simply Wall St analysis model here may be something of interest to you.
View our latest analysis for MMA Offshore
What's The Estimated Valuation?
We use what is known as a 2-stage model, which simply means we have two different periods of growth rates for the company's cash flows. Generally the first stage is higher growth, and the second stage is a lower growth phase. In the first stage we need to estimate the cash flows to the business over the next ten years. Where possible we use analyst estimates, but when these aren't available we extrapolate the previous free cash flow (FCF) from the last estimate or reported value. We assume companies with shrinking free cash flow will slow their rate of shrinkage, and that companies with growing free cash flow will see their growth rate slow, over this period. We do this to reflect that growth tends to slow more in the early years than it does in later years.
Generally we assume that a dollar today is more valuable than a dollar in the future, so we need to discount the sum of these future cash flows to arrive at a present value estimate:
10-year free cash flow (FCF) forecast
2023 | 2024 | 2025 | 2026 | 2027 | 2028 | 2029 | 2030 | 2031 | 2032 | |
Levered FCF (A$, Millions) | AU$69.8m | AU$24.5m | AU$33.4m | AU$33.7m | AU$34.0m | AU$34.5m | AU$35.1m | AU$35.6m | AU$36.3m | AU$36.9m |
Growth Rate Estimate Source | Analyst x1 | Analyst x1 | Analyst x1 | Est @ 0.79% | Est @ 1.14% | Est @ 1.39% | Est @ 1.56% | Est @ 1.68% | Est @ 1.76% | Est @ 1.82% |
Present Value (A$, Millions) Discounted @ 11% | AU$62.9 | AU$19.9 | AU$24.5 | AU$22.3 | AU$20.3 | AU$18.6 | AU$17.0 | AU$15.6 | AU$14.3 | AU$13.1 |
("Est" = FCF growth rate estimated by Simply Wall St)
Present Value of 10-year Cash Flow (PVCF) = AU$228m
After calculating the present value of future cash flows in the initial 10-year period, we need to calculate the Terminal Value, which accounts for all future cash flows beyond the first stage. For a number of reasons a very conservative growth rate is used that cannot exceed that of a country's GDP growth. In this case we have used the 5-year average of the 10-year government bond yield (2.0%) to estimate future growth. In the same way as with the 10-year 'growth' period, we discount future cash flows to today's value, using a cost of equity of 11%.
Terminal Value (TV)= FCF2032 × (1 + g) ÷ (r – g) = AU$37m× (1 + 2.0%) ÷ (11%– 2.0%) = AU$421m
Present Value of Terminal Value (PVTV)= TV / (1 + r)10= AU$421m÷ ( 1 + 11%)10= AU$150m
The total value, or equity value, is then the sum of the present value of the future cash flows, which in this case is AU$378m. The last step is to then divide the equity value by the number of shares outstanding. Relative to the current share price of AU$1.1, the company appears around fair value at the time of writing. Valuations are imprecise instruments though, rather like a telescope - move a few degrees and end up in a different galaxy. Do keep this in mind.
Important Assumptions
We would point out that the most important inputs to a discounted cash flow are the discount rate and of course the actual cash flows. You don't have to agree with these inputs, I recommend redoing the calculations yourself and playing with them. The DCF also does not consider the possible cyclicality of an industry, or a company's future capital requirements, so it does not give a full picture of a company's potential performance. Given that we are looking at MMA Offshore as potential shareholders, the cost of equity is used as the discount rate, rather than the cost of capital (or weighted average cost of capital, WACC) which accounts for debt. In this calculation we've used 11%, which is based on a levered beta of 1.506. Beta is a measure of a stock's volatility, compared to the market as a whole. We get our beta from the industry average beta of globally comparable companies, with an imposed limit between 0.8 and 2.0, which is a reasonable range for a stable business.
SWOT Analysis for MMA Offshore
Strength
Debt is not viewed as a risk.
Weakness
Expensive based on P/E ratio and estimated fair value.
Shareholders have been diluted in the past year.
Opportunity
Annual revenue is forecast to grow faster than the Australian market.
Threat
No apparent threats visible for MRM.
Next Steps:
Although the valuation of a company is important, it ideally won't be the sole piece of analysis you scrutinize for a company. It's not possible to obtain a foolproof valuation with a DCF model. Rather it should be seen as a guide to "what assumptions need to be true for this stock to be under/overvalued?" For example, changes in the company's cost of equity or the risk free rate can significantly impact the valuation. For MMA Offshore, we've put together three relevant aspects you should assess:
Risks: You should be aware of the 3 warning signs for MMA Offshore (2 make us uncomfortable!) we've uncovered before considering an investment in the company.
Future Earnings: How does MRM's growth rate compare to its peers and the wider market? Dig deeper into the analyst consensus number for the upcoming years by interacting with our free analyst growth expectation chart.
Other High Quality Alternatives: Do you like a good all-rounder? Explore our interactive list of high quality stocks to get an idea of what else is out there you may be missing!
PS. The Simply Wall St app conducts a discounted cash flow valuation for every stock on the ASX every day. If you want to find the calculation for other stocks just search here.
Have feedback on this article? Concerned about the content? Get in touch with us directly. Alternatively, email editorial-team (at) simplywallst.com.
This article by Simply Wall St is general in nature. We provide commentary based on historical data and analyst forecasts only using an unbiased methodology and our articles are not intended to be financial advice. It does not constitute a recommendation to buy or sell any stock, and does not take account of your objectives, or your financial situation. We aim to bring you long-term focused analysis driven by fundamental data. Note that our analysis may not factor in the latest price-sensitive company announcements or qualitative material. Simply Wall St has no position in any stocks mentioned.
Join A Paid User Research Session
You’ll receive a US$30 Amazon Gift card for 1 hour of your time while helping us build better investing tools for the individual investors like yourself. Sign up here
