Calculating The Intrinsic Value Of Santos Limited (ASX:STO)
Key Insights
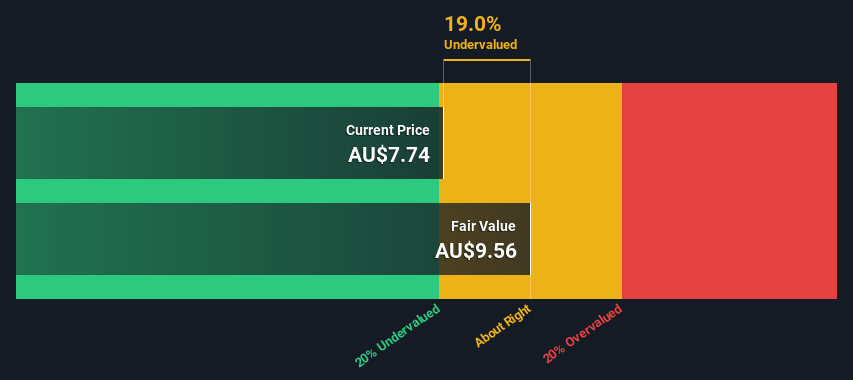
The projected fair value for Santos is AU$9.56 based on 2 Stage Free Cash Flow to Equity
Current share price of AU$7.74 suggests Santos is potentially trading close to its fair value
The US$9.02 analyst price target for STO is 5.6% less than our estimate of fair value
In this article we are going to estimate the intrinsic value of Santos Limited (ASX:STO) by taking the expected future cash flows and discounting them to their present value. Our analysis will employ the Discounted Cash Flow (DCF) model. Models like these may appear beyond the comprehension of a lay person, but they're fairly easy to follow.
We would caution that there are many ways of valuing a company and, like the DCF, each technique has advantages and disadvantages in certain scenarios. If you want to learn more about discounted cash flow, the rationale behind this calculation can be read in detail in the Simply Wall St analysis model.
See our latest analysis for Santos
Is Santos Fairly Valued?
We use what is known as a 2-stage model, which simply means we have two different periods of growth rates for the company's cash flows. Generally the first stage is higher growth, and the second stage is a lower growth phase. In the first stage we need to estimate the cash flows to the business over the next ten years. Where possible we use analyst estimates, but when these aren't available we extrapolate the previous free cash flow (FCF) from the last estimate or reported value. We assume companies with shrinking free cash flow will slow their rate of shrinkage, and that companies with growing free cash flow will see their growth rate slow, over this period. We do this to reflect that growth tends to slow more in the early years than it does in later years.
A DCF is all about the idea that a dollar in the future is less valuable than a dollar today, so we discount the value of these future cash flows to their estimated value in today's dollars:
10-year free cash flow (FCF) estimate
2024 | 2025 | 2026 | 2027 | 2028 | 2029 | 2030 | 2031 | 2032 | 2033 | |
Levered FCF ($, Millions) | US$396.2m | US$1.94b | US$1.73b | US$1.62b | US$1.55b | US$1.52b | US$1.50b | US$1.50b | US$1.51b | US$1.53b |
Growth Rate Estimate Source | Analyst x3 | Analyst x3 | Est @ -10.40% | Est @ -6.67% | Est @ -4.07% | Est @ -2.25% | Est @ -0.97% | Est @ -0.08% | Est @ 0.55% | Est @ 0.99% |
Present Value ($, Millions) Discounted @ 8.7% | US$365 | US$1.6k | US$1.4k | US$1.2k | US$1.0k | US$922 | US$840 | US$772 | US$715 | US$664 |
("Est" = FCF growth rate estimated by Simply Wall St)
Present Value of 10-year Cash Flow (PVCF) = US$9.5b
The second stage is also known as Terminal Value, this is the business's cash flow after the first stage. The Gordon Growth formula is used to calculate Terminal Value at a future annual growth rate equal to the 5-year average of the 10-year government bond yield of 2.0%. We discount the terminal cash flows to today's value at a cost of equity of 8.7%.
Terminal Value (TV)= FCF2033 × (1 + g) ÷ (r – g) = US$1.5b× (1 + 2.0%) ÷ (8.7%– 2.0%) = US$23b
Present Value of Terminal Value (PVTV)= TV / (1 + r)10= US$23b÷ ( 1 + 8.7%)10= US$10b
The total value, or equity value, is then the sum of the present value of the future cash flows, which in this case is US$20b. To get the intrinsic value per share, we divide this by the total number of shares outstanding. Compared to the current share price of AU$7.7, the company appears about fair value at a 19% discount to where the stock price trades currently. The assumptions in any calculation have a big impact on the valuation, so it is better to view this as a rough estimate, not precise down to the last cent.
The Assumptions
The calculation above is very dependent on two assumptions. The first is the discount rate and the other is the cash flows. Part of investing is coming up with your own evaluation of a company's future performance, so try the calculation yourself and check your own assumptions. The DCF also does not consider the possible cyclicality of an industry, or a company's future capital requirements, so it does not give a full picture of a company's potential performance. Given that we are looking at Santos as potential shareholders, the cost of equity is used as the discount rate, rather than the cost of capital (or weighted average cost of capital, WACC) which accounts for debt. In this calculation we've used 8.7%, which is based on a levered beta of 1.332. Beta is a measure of a stock's volatility, compared to the market as a whole. We get our beta from the industry average beta of globally comparable companies, with an imposed limit between 0.8 and 2.0, which is a reasonable range for a stable business.
SWOT Analysis for Santos
Strength
Earnings growth over the past year exceeded the industry.
Debt is not viewed as a risk.
Dividends are covered by earnings and cash flows.
Weakness
Earnings growth over the past year is below its 5-year average.
Dividend is low compared to the top 25% of dividend payers in the Oil and Gas market.
Opportunity
Annual earnings are forecast to grow for the next 3 years.
Good value based on P/E ratio and estimated fair value.
Threat
Annual earnings are forecast to grow slower than the Australian market.
Next Steps:
Although the valuation of a company is important, it ideally won't be the sole piece of analysis you scrutinize for a company. DCF models are not the be-all and end-all of investment valuation. Instead the best use for a DCF model is to test certain assumptions and theories to see if they would lead to the company being undervalued or overvalued. For instance, if the terminal value growth rate is adjusted slightly, it can dramatically alter the overall result. For Santos, we've compiled three relevant elements you should assess:
Risks: Consider for instance, the ever-present spectre of investment risk. We've identified 2 warning signs with Santos , and understanding them should be part of your investment process.
Management:Have insiders been ramping up their shares to take advantage of the market's sentiment for STO's future outlook? Check out our management and board analysis with insights on CEO compensation and governance factors.
Other High Quality Alternatives: Do you like a good all-rounder? Explore our interactive list of high quality stocks to get an idea of what else is out there you may be missing!
PS. Simply Wall St updates its DCF calculation for every Australian stock every day, so if you want to find the intrinsic value of any other stock just search here.
Have feedback on this article? Concerned about the content? Get in touch with us directly. Alternatively, email editorial-team (at) simplywallst.com.
This article by Simply Wall St is general in nature. We provide commentary based on historical data and analyst forecasts only using an unbiased methodology and our articles are not intended to be financial advice. It does not constitute a recommendation to buy or sell any stock, and does not take account of your objectives, or your financial situation. We aim to bring you long-term focused analysis driven by fundamental data. Note that our analysis may not factor in the latest price-sensitive company announcements or qualitative material. Simply Wall St has no position in any stocks mentioned.
