Calculating The Intrinsic Value Of Tencent Music Entertainment Group (NYSE:TME)
Key Insights
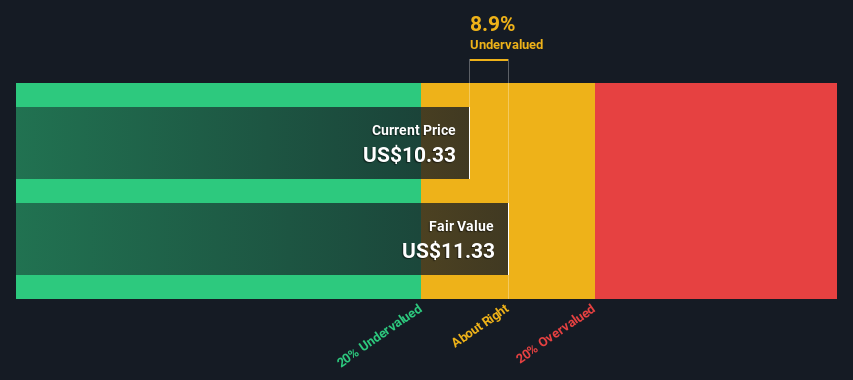
The projected fair value for Tencent Music Entertainment Group is US$11.33 based on 2 Stage Free Cash Flow to Equity
Tencent Music Entertainment Group's US$10.33 share price indicates it is trading at similar levels as its fair value estimate
Analyst price target for TME is CN¥10.07 which is 11% below our fair value estimate
How far off is Tencent Music Entertainment Group (NYSE:TME) from its intrinsic value? Using the most recent financial data, we'll take a look at whether the stock is fairly priced by projecting its future cash flows and then discounting them to today's value. We will take advantage of the Discounted Cash Flow (DCF) model for this purpose. Don't get put off by the jargon, the math behind it is actually quite straightforward.
Remember though, that there are many ways to estimate a company's value, and a DCF is just one method. If you want to learn more about discounted cash flow, the rationale behind this calculation can be read in detail in the Simply Wall St analysis model.
View our latest analysis for Tencent Music Entertainment Group
What's The Estimated Valuation?
We are going to use a two-stage DCF model, which, as the name states, takes into account two stages of growth. The first stage is generally a higher growth period which levels off heading towards the terminal value, captured in the second 'steady growth' period. In the first stage we need to estimate the cash flows to the business over the next ten years. Where possible we use analyst estimates, but when these aren't available we extrapolate the previous free cash flow (FCF) from the last estimate or reported value. We assume companies with shrinking free cash flow will slow their rate of shrinkage, and that companies with growing free cash flow will see their growth rate slow, over this period. We do this to reflect that growth tends to slow more in the early years than it does in later years.
Generally we assume that a dollar today is more valuable than a dollar in the future, so we need to discount the sum of these future cash flows to arrive at a present value estimate:
10-year free cash flow (FCF) estimate
2024 | 2025 | 2026 | 2027 | 2028 | 2029 | 2030 | 2031 | 2032 | 2033 | |
Levered FCF (CN¥, Millions) | CN¥5.64b | CN¥6.77b | CN¥7.36b | CN¥8.09b | CN¥8.50b | CN¥8.83b | CN¥9.13b | CN¥9.41b | CN¥9.67b | CN¥9.93b |
Growth Rate Estimate Source | Analyst x8 | Analyst x7 | Analyst x3 | Analyst x2 | Analyst x2 | Est @ 3.86% | Est @ 3.39% | Est @ 3.06% | Est @ 2.83% | Est @ 2.67% |
Present Value (CN¥, Millions) Discounted @ 8.4% | CN¥5.2k | CN¥5.8k | CN¥5.8k | CN¥5.9k | CN¥5.7k | CN¥5.4k | CN¥5.2k | CN¥4.9k | CN¥4.7k | CN¥4.4k |
("Est" = FCF growth rate estimated by Simply Wall St)
Present Value of 10-year Cash Flow (PVCF) = CN¥53b
We now need to calculate the Terminal Value, which accounts for all the future cash flows after this ten year period. For a number of reasons a very conservative growth rate is used that cannot exceed that of a country's GDP growth. In this case we have used the 5-year average of the 10-year government bond yield (2.3%) to estimate future growth. In the same way as with the 10-year 'growth' period, we discount future cash flows to today's value, using a cost of equity of 8.4%.
Terminal Value (TV)= FCF2033 × (1 + g) ÷ (r – g) = CN¥9.9b× (1 + 2.3%) ÷ (8.4%– 2.3%) = CN¥167b
Present Value of Terminal Value (PVTV)= TV / (1 + r)10= CN¥167b÷ ( 1 + 8.4%)10= CN¥75b
The total value, or equity value, is then the sum of the present value of the future cash flows, which in this case is CN¥128b. The last step is to then divide the equity value by the number of shares outstanding. Relative to the current share price of US$10.3, the company appears about fair value at a 8.9% discount to where the stock price trades currently. The assumptions in any calculation have a big impact on the valuation, so it is better to view this as a rough estimate, not precise down to the last cent.
Important Assumptions
The calculation above is very dependent on two assumptions. The first is the discount rate and the other is the cash flows. If you don't agree with these result, have a go at the calculation yourself and play with the assumptions. The DCF also does not consider the possible cyclicality of an industry, or a company's future capital requirements, so it does not give a full picture of a company's potential performance. Given that we are looking at Tencent Music Entertainment Group as potential shareholders, the cost of equity is used as the discount rate, rather than the cost of capital (or weighted average cost of capital, WACC) which accounts for debt. In this calculation we've used 8.4%, which is based on a levered beta of 1.081. Beta is a measure of a stock's volatility, compared to the market as a whole. We get our beta from the industry average beta of globally comparable companies, with an imposed limit between 0.8 and 2.0, which is a reasonable range for a stable business.
SWOT Analysis for Tencent Music Entertainment Group
Strength
Earnings growth over the past year exceeded the industry.
Debt is not viewed as a risk.
Weakness
No major weaknesses identified for TME.
Opportunity
Annual earnings are forecast to grow for the next 4 years.
Current share price is below our estimate of fair value.
Threat
Annual earnings are forecast to grow slower than the American market.
Moving On:
Valuation is only one side of the coin in terms of building your investment thesis, and it ideally won't be the sole piece of analysis you scrutinize for a company. It's not possible to obtain a foolproof valuation with a DCF model. Rather it should be seen as a guide to "what assumptions need to be true for this stock to be under/overvalued?" If a company grows at a different rate, or if its cost of equity or risk free rate changes sharply, the output can look very different. For Tencent Music Entertainment Group, we've compiled three pertinent aspects you should look at:
Financial Health: Does TME have a healthy balance sheet? Take a look at our free balance sheet analysis with six simple checks on key factors like leverage and risk.
Future Earnings: How does TME's growth rate compare to its peers and the wider market? Dig deeper into the analyst consensus number for the upcoming years by interacting with our free analyst growth expectation chart.
Other High Quality Alternatives: Do you like a good all-rounder? Explore our interactive list of high quality stocks to get an idea of what else is out there you may be missing!
PS. The Simply Wall St app conducts a discounted cash flow valuation for every stock on the NYSE every day. If you want to find the calculation for other stocks just search here.
Have feedback on this article? Concerned about the content? Get in touch with us directly. Alternatively, email editorial-team (at) simplywallst.com.
This article by Simply Wall St is general in nature. We provide commentary based on historical data and analyst forecasts only using an unbiased methodology and our articles are not intended to be financial advice. It does not constitute a recommendation to buy or sell any stock, and does not take account of your objectives, or your financial situation. We aim to bring you long-term focused analysis driven by fundamental data. Note that our analysis may not factor in the latest price-sensitive company announcements or qualitative material. Simply Wall St has no position in any stocks mentioned.
