Calculating The Intrinsic Value Of Tredegar Corporation (NYSE:TG)
Key Insights
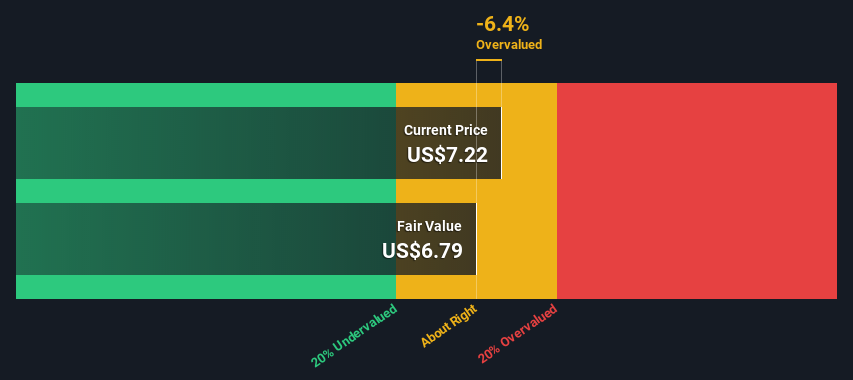
The projected fair value for Tredegar is US$6.79 based on Dividend Discount Model
Current share price of US$7.22 suggests Tredegar is potentially trading close to its fair value
Industry average of 23% suggests Tredegar's peers are currently trading at a higher premium to fair value
How far off is Tredegar Corporation (NYSE:TG) from its intrinsic value? Using the most recent financial data, we'll take a look at whether the stock is fairly priced by projecting its future cash flows and then discounting them to today's value. Our analysis will employ the Discounted Cash Flow (DCF) model. Believe it or not, it's not too difficult to follow, as you'll see from our example!
We generally believe that a company's value is the present value of all of the cash it will generate in the future. However, a DCF is just one valuation metric among many, and it is not without flaws. If you still have some burning questions about this type of valuation, take a look at the Simply Wall St analysis model.
See our latest analysis for Tredegar
The Model
We have to calculate the value of Tredegar slightly differently to other stocks because it is a metals and mining company. Instead of using free cash flows, which are hard to estimate and often not reported by analysts in this industry, dividends per share (DPS) payments are used. This often underestimates the value of a stock, but it can still be good as a comparison to competitors. We use the Gordon Growth Model, which assumes dividend will grow into perpetuity at a rate that can be sustained. The dividend is expected to grow at an annual growth rate equal to the 5-year average of the 10-year government bond yield of 2.1%. We then discount this figure to today's value at a cost of equity of 9.8%. Relative to the current share price of US$7.2, the company appears around fair value at the time of writing. Remember though, that this is just an approximate valuation, and like any complex formula - garbage in, garbage out.
Value Per Share = Expected Dividend Per Share / (Discount Rate - Perpetual Growth Rate)
= US$0.5 / (9.8% – 2.1%)
= US$6.8
Important Assumptions
Now the most important inputs to a discounted cash flow are the discount rate, and of course, the actual cash flows. You don't have to agree with these inputs, I recommend redoing the calculations yourself and playing with them. The DCF also does not consider the possible cyclicality of an industry, or a company's future capital requirements, so it does not give a full picture of a company's potential performance. Given that we are looking at Tredegar as potential shareholders, the cost of equity is used as the discount rate, rather than the cost of capital (or weighted average cost of capital, WACC) which accounts for debt. In this calculation we've used 9.8%, which is based on a levered beta of 1.290. Beta is a measure of a stock's volatility, compared to the market as a whole. We get our beta from the industry average beta of globally comparable companies, with an imposed limit between 0.8 and 2.0, which is a reasonable range for a stable business.
SWOT Analysis for Tredegar
Strength
Dividend is in the top 25% of dividend payers in the market.
Weakness
Earnings declined over the past year.
Interest payments on debt are not well covered.
Current share price is above our estimate of fair value.
Opportunity
TG's financial characteristics indicate limited near-term opportunities for shareholders.
Lack of analyst coverage makes it difficult to determine TG's earnings prospects.
Threat
Debt is not well covered by operating cash flow.
Dividends are not covered by earnings.
Looking Ahead:
Whilst important, the DCF calculation ideally won't be the sole piece of analysis you scrutinize for a company. It's not possible to obtain a foolproof valuation with a DCF model. Preferably you'd apply different cases and assumptions and see how they would impact the company's valuation. If a company grows at a different rate, or if its cost of equity or risk free rate changes sharply, the output can look very different. For Tredegar, we've put together three relevant items you should assess:
Risks: For instance, we've identified 4 warning signs for Tredegar (2 don't sit too well with us) you should be aware of.
Other Solid Businesses: Low debt, high returns on equity and good past performance are fundamental to a strong business. Why not explore our interactive list of stocks with solid business fundamentals to see if there are other companies you may not have considered!
Other Top Analyst Picks: Interested to see what the analysts are thinking? Take a look at our interactive list of analysts' top stock picks to find out what they feel might have an attractive future outlook!
PS. Simply Wall St updates its DCF calculation for every American stock every day, so if you want to find the intrinsic value of any other stock just search here.
Have feedback on this article? Concerned about the content? Get in touch with us directly. Alternatively, email editorial-team (at) simplywallst.com.
This article by Simply Wall St is general in nature. We provide commentary based on historical data and analyst forecasts only using an unbiased methodology and our articles are not intended to be financial advice. It does not constitute a recommendation to buy or sell any stock, and does not take account of your objectives, or your financial situation. We aim to bring you long-term focused analysis driven by fundamental data. Note that our analysis may not factor in the latest price-sensitive company announcements or qualitative material. Simply Wall St has no position in any stocks mentioned.
Join A Paid User Research Session
You’ll receive a US$30 Amazon Gift card for 1 hour of your time while helping us build better investing tools for the individual investors like yourself. Sign up here
