Calculating The Intrinsic Value Of Velan Inc. (TSE:VLN)
Key Insights
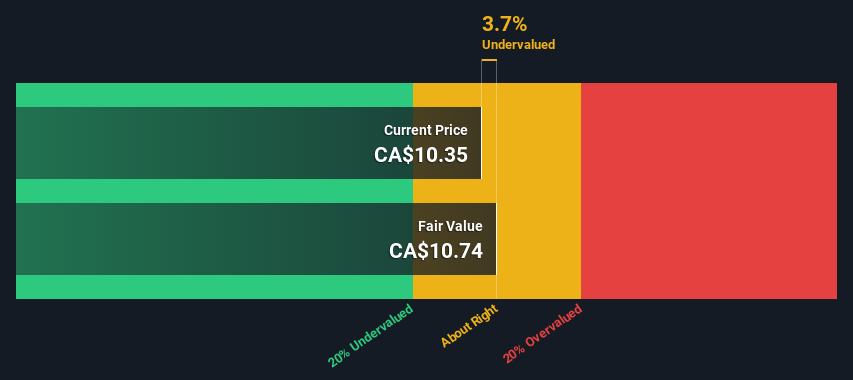
The projected fair value for Velan is CA$10.74 based on 2 Stage Free Cash Flow to Equity
With CA$10.35 share price, Velan appears to be trading close to its estimated fair value
Peers of Velan are currently trading on average at a 12% premium
In this article we are going to estimate the intrinsic value of Velan Inc. (TSE:VLN) by projecting its future cash flows and then discounting them to today's value. Our analysis will employ the Discounted Cash Flow (DCF) model. Before you think you won't be able to understand it, just read on! It's actually much less complex than you'd imagine.
We would caution that there are many ways of valuing a company and, like the DCF, each technique has advantages and disadvantages in certain scenarios. If you still have some burning questions about this type of valuation, take a look at the Simply Wall St analysis model.
View our latest analysis for Velan
What's The Estimated Valuation?
We're using the 2-stage growth model, which simply means we take in account two stages of company's growth. In the initial period the company may have a higher growth rate and the second stage is usually assumed to have a stable growth rate. In the first stage we need to estimate the cash flows to the business over the next ten years. Seeing as no analyst estimates of free cash flow are available to us, we have extrapolate the previous free cash flow (FCF) from the company's last reported value. We assume companies with shrinking free cash flow will slow their rate of shrinkage, and that companies with growing free cash flow will see their growth rate slow, over this period. We do this to reflect that growth tends to slow more in the early years than it does in later years.
Generally we assume that a dollar today is more valuable than a dollar in the future, so we discount the value of these future cash flows to their estimated value in today's dollars:
10-year free cash flow (FCF) estimate
2024 | 2025 | 2026 | 2027 | 2028 | 2029 | 2030 | 2031 | 2032 | 2033 | |
Levered FCF ($, Millions) | US$7.03m | US$8.02m | US$8.86m | US$9.55m | US$10.1m | US$10.6m | US$11.0m | US$11.4m | US$11.7m | US$12.0m |
Growth Rate Estimate Source | Est @ 19.29% | Est @ 14.06% | Est @ 10.40% | Est @ 7.84% | Est @ 6.04% | Est @ 4.79% | Est @ 3.91% | Est @ 3.30% | Est @ 2.86% | Est @ 2.56% |
Present Value ($, Millions) Discounted @ 7.5% | US$6.5 | US$6.9 | US$7.1 | US$7.1 | US$7.0 | US$6.9 | US$6.6 | US$6.4 | US$6.1 | US$5.8 |
("Est" = FCF growth rate estimated by Simply Wall St)
Present Value of 10-year Cash Flow (PVCF) = US$67m
After calculating the present value of future cash flows in the initial 10-year period, we need to calculate the Terminal Value, which accounts for all future cash flows beyond the first stage. The Gordon Growth formula is used to calculate Terminal Value at a future annual growth rate equal to the 5-year average of the 10-year government bond yield of 1.9%. We discount the terminal cash flows to today's value at a cost of equity of 7.5%.
Terminal Value (TV)= FCF2033 × (1 + g) ÷ (r – g) = US$12m× (1 + 1.9%) ÷ (7.5%– 1.9%) = US$215m
Present Value of Terminal Value (PVTV)= TV / (1 + r)10= US$215m÷ ( 1 + 7.5%)10= US$104m
The total value is the sum of cash flows for the next ten years plus the discounted terminal value, which results in the Total Equity Value, which in this case is US$171m. To get the intrinsic value per share, we divide this by the total number of shares outstanding. Relative to the current share price of CA$10.4, the company appears about fair value at a 3.7% discount to where the stock price trades currently. Valuations are imprecise instruments though, rather like a telescope - move a few degrees and end up in a different galaxy. Do keep this in mind.
Important Assumptions
The calculation above is very dependent on two assumptions. The first is the discount rate and the other is the cash flows. You don't have to agree with these inputs, I recommend redoing the calculations yourself and playing with them. The DCF also does not consider the possible cyclicality of an industry, or a company's future capital requirements, so it does not give a full picture of a company's potential performance. Given that we are looking at Velan as potential shareholders, the cost of equity is used as the discount rate, rather than the cost of capital (or weighted average cost of capital, WACC) which accounts for debt. In this calculation we've used 7.5%, which is based on a levered beta of 1.137. Beta is a measure of a stock's volatility, compared to the market as a whole. We get our beta from the industry average beta of globally comparable companies, with an imposed limit between 0.8 and 2.0, which is a reasonable range for a stable business.
SWOT Analysis for Velan
Strength
Debt is not viewed as a risk.
Weakness
Dividend is low compared to the top 25% of dividend payers in the Machinery market.
Opportunity
Has sufficient cash runway for more than 3 years based on current free cash flows.
Current share price is below our estimate of fair value.
Lack of analyst coverage makes it difficult to determine VLN's earnings prospects.
Threat
Paying a dividend but company is unprofitable.
Looking Ahead:
Although the valuation of a company is important, it ideally won't be the sole piece of analysis you scrutinize for a company. It's not possible to obtain a foolproof valuation with a DCF model. Preferably you'd apply different cases and assumptions and see how they would impact the company's valuation. If a company grows at a different rate, or if its cost of equity or risk free rate changes sharply, the output can look very different. For Velan, there are three additional factors you should further research:
Risks: We feel that you should assess the 1 warning sign for Velan we've flagged before making an investment in the company.
Other High Quality Alternatives: Do you like a good all-rounder? Explore our interactive list of high quality stocks to get an idea of what else is out there you may be missing!
Other Top Analyst Picks: Interested to see what the analysts are thinking? Take a look at our interactive list of analysts' top stock picks to find out what they feel might have an attractive future outlook!
PS. The Simply Wall St app conducts a discounted cash flow valuation for every stock on the TSX every day. If you want to find the calculation for other stocks just search here.
Have feedback on this article? Concerned about the content? Get in touch with us directly. Alternatively, email editorial-team (at) simplywallst.com.
This article by Simply Wall St is general in nature. We provide commentary based on historical data and analyst forecasts only using an unbiased methodology and our articles are not intended to be financial advice. It does not constitute a recommendation to buy or sell any stock, and does not take account of your objectives, or your financial situation. We aim to bring you long-term focused analysis driven by fundamental data. Note that our analysis may not factor in the latest price-sensitive company announcements or qualitative material. Simply Wall St has no position in any stocks mentioned.
