Callon (CPE) Beats on Q2 Earnings, Reiterates Production View
Callon Petroleum Company CPE reported second-quarter 2023 adjusted earnings of $1.99 per share, beating the Zacks Consensus Estimate of $1.78. The bottom line significantly declined from the $3.11 reported a year ago.
Operating revenues of $562.3 million beat the Zacks Consensus Estimate of $542 million. However, the top line declined from the year-ago quarter’s $913.6 million.
Better-than-expected quarterly results were driven by higher oil-equivalent production volumes. The positives were partially offset by lower realized oil-equivalent prices and higher expenses.
Callon Petroleum Company Price, Consensus and EPS Surprise
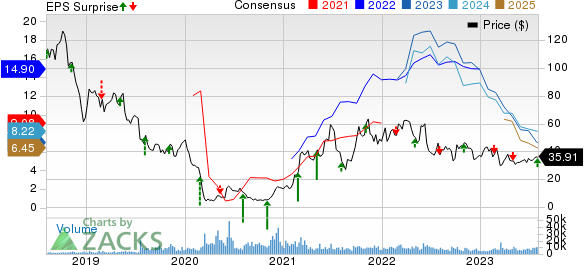
Callon Petroleum Company price-consensus-eps-surprise-chart | Callon Petroleum Company Quote
Production
In the second quarter, CPE’s net production volumes averaged 106,948 barrels of oil-equivalent per day (Boe/d), up from the year-ago period’s 100,685 Boe/d. The metric is almost in line with our projection figure. Production volumes increased in the Permian Basin, while the same in Eagle Ford declined from the year-ago quarter. Of the total second-quarter production, 59% was oil.
Callon’s oil production in the quarter was 5,737 thousand barrels (MBbls), up from the year-ago level of 5,589 MBbls.
Natural gas production increased to 11,701 million cubic feet (MMcf) from 10,312 MMcf and also beat out estimate of 11,171 MMcf.
Also, natural gas liquids (NGLs) production in the quarter under review was 2,045 MBbls, up from the year-ago figure of 1,854 MBbls. The metric is also above our projection of 2,005 MBbls.
Price Realizations (Without Cash-Settled Derivative Impacts)
The average realized price per barrel of oil-equivalent was $49. The figure declined from the year-ago quarter’s $82.98. The average realized price for oil was $73.52 per barrel compared with $110.90 a year ago. The average realized price per barrel for NGLs was $19.87, lower than the year-ago level of $40.74.
The average realized price for natural gas was $1.23 per thousand cubic feet, down from $6.29. The metric is also below our projection of $1.86 per thousand cubic feet.
Total Expenses
Callon’s total operating expenses of $785 million significantly increased from the year-ago level of $435 million. The metric is also above our projection of $413.6 million.
Total lease operating costs increased to $76.8 million from the year-ago level of $73 million. The company’s per-unit lease operating expenses declined to $7.89 per barrel of oil equivalent in the reported quarter from $7.96 a year ago.
Capital Expenditure & Balance Sheet
The capital expenditure in the reported quarter was $293.7 million. Callon generated an adjusted free cash flow of $12.3 million, significantly down from $125.2 million a year ago.
As of Jun 30, 2023, the company’s total cash and cash equivalents amounted to $3.7 million. The long-term debt totaled $2,268.1 million.
Guidance
For the third quarter, Callon expects to produce 100-103 thousand barrels of oil-equivalent per day (MBoe/d), including oil volumes of 60-62 MBbls/d. The company gave an operational capital budget of $250-$275 million for the third quarter.
For 2023, the company’s production and capital expenditure guidance is unchanged.
Zacks Rank & Stocks to Consider
Callon currently carries a Zacks Rank #5 (Strong Sell).
Investors interested in the energy sector might look at the following companies that presently flaunt a Zacks Rank #1 (Strong Buy). You can see the complete list of today’s Zacks #1 Rank stocks here.
Crestwood Equity Partners LP’s CEQP second-quarter 2023 adjusted earnings of $1.16 per unit, surpassing the Zacks Consensus Estimate of 26 cents. Strong quarterly earnings resulted from fantastic contributions from the Storage and Logistics business unit.
For this year, the partnership projects adjusted EBITDA of $780-$860 million. CEQP has witnessed upward earnings estimate revisions for 2023 and 2024 in the past 60 days.
Oceaneering International, Inc. OII reported a second-quarter 2023 adjusted profit of 18 cents per share, which missed the Zacks Consensus Estimate of 30 cents. This underperformance was due to lower-than-expected operating income from the Subsea Robotics and Manufactured Products segments.
For 2023, Oceaneering projects consolidated EBITDA of $2275-$310 million and a continued free cash flow generation of $90-$130 million. OII has witnessed upward earnings estimate revisions for 2023 and 2024 in the past 60 days.
Evolution Petroleum EPM is an independent energy company. EPM has a Zacks Style Score of A for Growth.
Evolution Petroleum has witnessed upward earnings estimate revisions for 2023 and 2024 in the past 60 days. The consensus estimate for EPM’s 2023 and 2024 earnings per share is pegged at $1.11 and $1.08, respectively.
Want the latest recommendations from Zacks Investment Research? Today, you can download 7 Best Stocks for the Next 30 Days. Click to get this free report
Oceaneering International, Inc. (OII) : Free Stock Analysis Report
Evolution Petroleum Corporation, Inc. (EPM) : Free Stock Analysis Report
Crestwood Equity Partners LP (CEQP) : Free Stock Analysis Report
Callon Petroleum Company (CPE) : Free Stock Analysis Report
