Callon (CPE) Beats on Q3 Earnings, Revenues Fall Year Over Year
Callon Petroleum Company CPE reported third-quarter 2023 adjusted earnings of $1.82 per share, which beat the Zacks Consensus Estimate of $1.79. However, the bottom line declined from $4.04 reported a year ago.
Operating revenues of $619 million beat the Zacks Consensus Estimate of $573 million. However, the top line declined from the year-ago quarter’s level of $836 million.
Better-than-expected quarterly results were driven by lower total operating expenses. The positives were partially offset by lower realized oil-equivalent prices and production volumes.
Callon Petroleum Company Price, Consensus and EPS Surprise
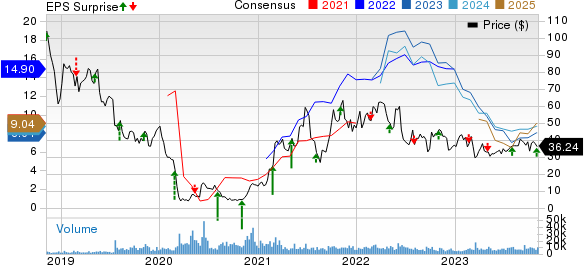
Callon Petroleum Company price-consensus-eps-surprise-chart | Callon Petroleum Company Quote
Production
In the third quarter, CPE’s net production volume was 101,741 barrels of oil-equivalent per day (Boe/d), down from the year-ago period’s figure of 107,316 Boe/d. Our projection for the same was pinned at 100,617 Boe/d. Production volume increased in the Permian Basin, while the same in Eagle Ford declined year over year. Of the total third-quarter production, 57% was oil.
Callon’s oil production in the quarter totaled 5,338 thousand barrels (MBbls), down from the year-ago level of 6,112 MBbls. Oil volume during the period was negatively impacted by weather-related power and midstream disruptions in August and September and a lower-than-expected oil mix from recent completions in the Delaware West area.
Natural gas production increased to 11,688 million cubic feet (MMcf) from 10,657 MMcf. The figure also beat out estimate of 10,170 MMcf.
Also, natural gas liquids (NGLs) production in the quarter under review totaled 2,075 MBbls, up from the year-ago figure of 1,985 MBbls. The metric was also above our projection of 2,009.7 MBbls.
Price Realizations (Without Cash-Settled Derivative Impacts)
The average realized price per barrel of oil equivalent was $54.50. The figure declined from the year-ago quarter’s level of $73.37 and also came in lower than our estimate of $58.95.
The average realized price for oil was $82.18 per barrel compared with $94.22 a year ago. The average realized price per barrel for NGLs was $22.40, lower than the year-ago level of $34.03. The figure was also lower than our estimate of $23.02.
The average realized price for natural gas was $2.14 per thousand cubic feet, down from $7.60 a year ago.
Total Expenses
Callon’s total operating expenses of $398 million decreased from the year-ago level of $415 million.
Total lease operating costs decreased to $73.5 million from the prior-year figure of $76.1 million. However, the company’s per-unit lease operating expenses increased to $7.85 per barrel of oil equivalent from $7.71 a year ago.
Capital Expenditure & Balance Sheet
The capital expenditure in the reported quarter amounted to $252.4 million. Callon generated an adjusted free cash flow of $48.3 million, significantly down from $147.9 million reported a year ago.
As of Sep 30, 2023, the company’s total cash and cash equivalents amounted to $3.5 million. The long-term debt totaled $1,948.6 million.
Guidance
For the fourth quarter, Callon lowered its estimation for production to the range of 100-103 thousand barrels of oil-equivalent per day (MBoe/d), including oil volumes of 56-59 MBbls/d. The previous projection for the same was in the 104-108 MBoe/d range.
The full-year 2023 total and oil production is now expected to be in the band of 102-104 MBoe/d, including oil volumes of 59-61 MBbls/d. The previous projection for the same was in the 103-106 MBoe/d range.
For 2023, the company’s production and capital expenditure projection remains unchanged in the range of $960-$980 million.
Zacks Rank & Other Stocks to Consider
Callon currently carries a Zacks Rank #2 (Buy).
Some other top-ranked players in the energy sector are Liberty Energy Inc. LBRT, Matador Resources Company MTDR and Oceaneering International, Inc. OII, each currently sporting a Zacks Rank #1 (Strong Buy). You can see the complete list of today’s Zacks #1 Rank stocks here.
Liberty reported third-quarter 2023 earnings of 85 cents per share, which beat the Zacks Consensus Estimate of 74 cents. The Denver-CO-based oil and gas equipment company’s outperformance reflects the impacts of strong execution and increased service pricing.
The company’s board of directors announced a cash dividend of 7 cents per common share, payable on Dec 20, 2023, to stockholders of record as of Dec 6, 2023. The dividend increased 40% from the previous quarter’s level.
Matador Resources reported third-quarter 2023 adjusted earnings of $1.86 per share, which beat the Zacks Consensus Estimate of $1.59. MTDR’s milestone led to better-than-expected third-quarter results, with the highest-ever total production averaging more than 135,000 barrels of oil and natural gas equivalent per day.
For the fourth quarter of 2023, MTDR expects an average daily oil equivalent production of 145,000 BOE. The recent guidance indicates a 2% upward revision from the previously mentioned 143,000 BOE/D.
Oceaneering International reported third-quarter 2023 adjusted earnings of 38 cents per share, which beat the Zacks Consensus Estimate of 27 cents. OII’s outperformance was largely due to robust results in certain segments.
For the fourth quarter of 2023, OII anticipates a decline in EBITDA on relatively flat revenues compared with the third-quarter results.
Want the latest recommendations from Zacks Investment Research? Today, you can download 7 Best Stocks for the Next 30 Days. Click to get this free report
Oceaneering International, Inc. (OII) : Free Stock Analysis Report
Matador Resources Company (MTDR) : Free Stock Analysis Report
Callon Petroleum Company (CPE) : Free Stock Analysis Report
Liberty Energy Inc. (LBRT) : Free Stock Analysis Report
