Canadian Natural Resources (CNQ): A Closer Look at Its Market Valuation
Canadian Natural Resources Ltd (NYSE:CNQ) recently experienced a 6.3% daily gain, contributing to a 19.12% gain over the past three months. With an Earnings Per Share (EPS) of 5.05, the question arises: Is the stock modestly overvalued? This article attempts to answer this question through a comprehensive valuation analysis. Read on for an insightful exploration of the intrinsic value of Canadian Natural Resources (NYSE:CNQ).
Company Overview
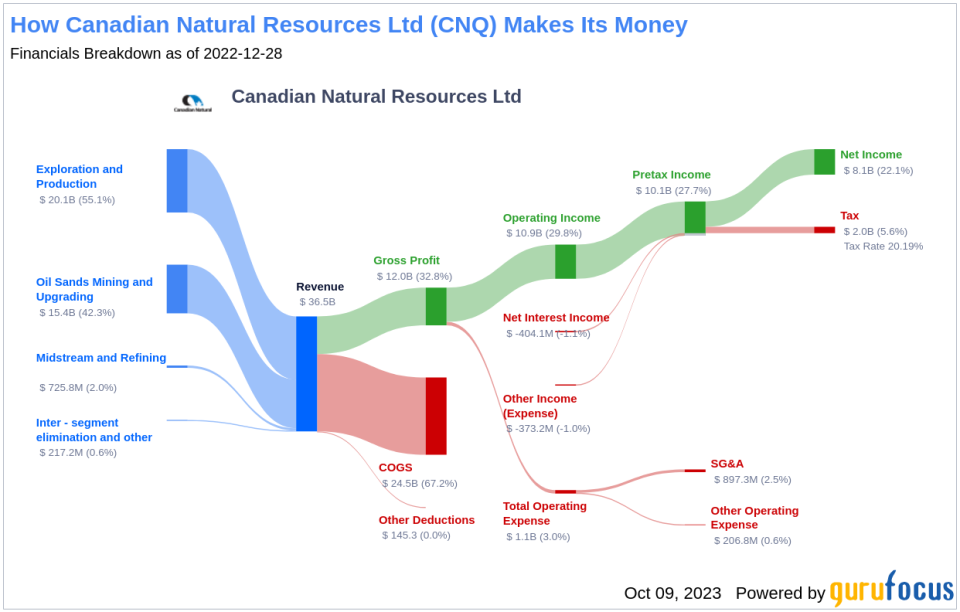
Canadian Natural Resources Ltd is an independent crude oil and natural gas exploration, development, and production company. Its operations span across North America, especially Western Canada, the UK portion of the North Sea, and Offshore Africa in Cote d'Ivoire and South Africa. The company focuses on the exploration, development, production, and marketing of crude oil, natural gas liquids, and natural gas. It operates two divisions: Oil Sands Mining and Upgrading Midstream and Refining, with the majority of its revenue coming from North America.
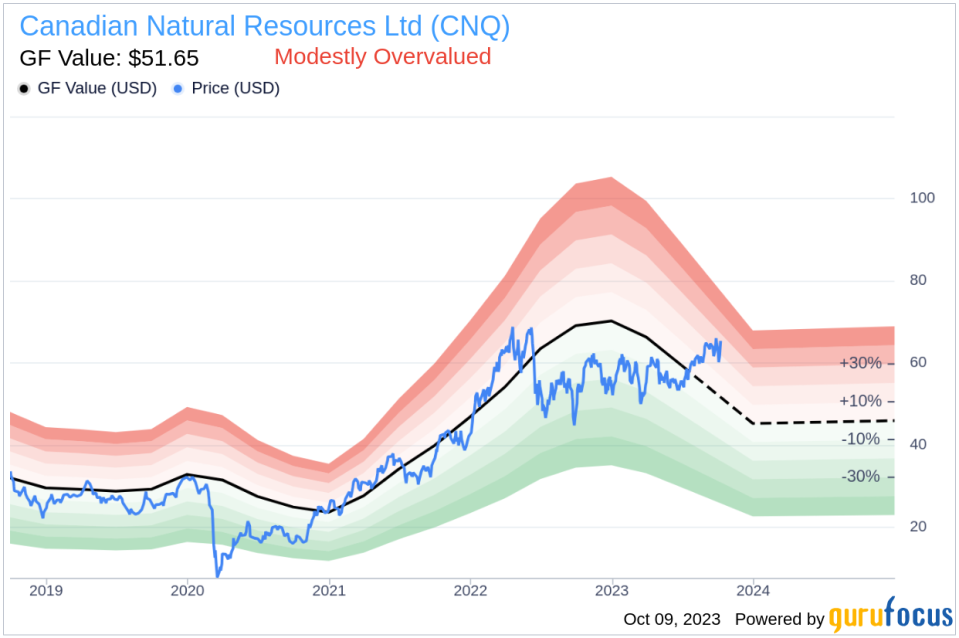
Comparing the stock price of Canadian Natural Resources (NYSE:CNQ) with its GF Value, an estimation of fair value, provides a deeper understanding of the company's value. This comparison ingeniously integrates financial assessment with essential company details.
Understanding GF Value
The GF Value is an exclusive method to estimate the current intrinsic value of a stock. It is calculated based on three factors: historical multiples (PE Ratio, PS Ratio, PB Ratio, and Price-to-Free-Cash-Flow) that the stock has traded at, a GuruFocus adjustment factor based on the company's past returns and growth, and future estimates of the business performance. The GF Value Line on our summary page gives an overview of the fair value that the stock should be traded at.
If the stock price is significantly above the GF Value Line, it is overvalued and its future return is likely to be poor. On the other hand, if it is significantly below the GF Value Line, its future return will likely be higher.
Based on GuruFocus valuation, the stock of Canadian Natural Resources (NYSE:CNQ) is estimated to be modestly overvalued. At its current price of $ 65.29 per share, Canadian Natural Resources stock is estimated to be modestly overvalued. As a result, the long-term return of its stock is likely to be lower than its business growth.
Link: These companies may deliver higher future returns at reduced risk.
Financial Strength
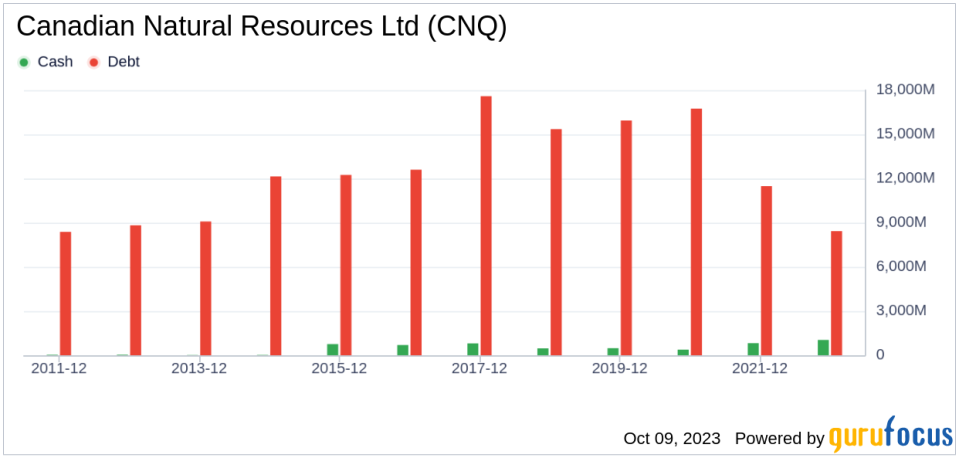
Before investing in a company, it's crucial to assess its financial strength. Investing in companies with poor financial strength have a higher risk of permanent loss. A great way to understand the financial strength of a company is by looking at the cash-to-debt ratio and interest coverage. Canadian Natural Resources has a cash-to-debt ratio of 0.05, which is worse than 85.62% of 1029 companies in the Oil & Gas industry. The overall financial strength of Canadian Natural Resources is 6 out of 10, which indicates that the financial strength of Canadian Natural Resources is fair.
Profitability and Growth
Investing in profitable companies, especially those with consistent profitability over the long term, is less risky. A company with high profit margins is usually a safer investment than those with low profit margins. Canadian Natural Resources has been profitable 7 over the past 10 years. Over the past twelve months, the company had a revenue of $31.20 Billion and Earnings Per Share (EPS) of $5.05. Its operating margin is 23.3%, which ranks better than 70.98% of 982 companies in the Oil & Gas industry. Overall, the profitability of Canadian Natural Resources is ranked 7 out of 10, which indicates fair profitability.
Growth is probably the most important factor in the valuation of a company. A faster growing company creates more value for shareholders, especially if the growth is profitable. The 3-year average annual revenue growth of Canadian Natural Resources is 28.2%, which ranks better than 81.59% of 858 companies in the Oil & Gas industry. The 3-year average EBITDA growth rate is 25.5%, which ranks better than 62.65% of 822 companies in the Oil & Gas industry.
ROIC vs WACC
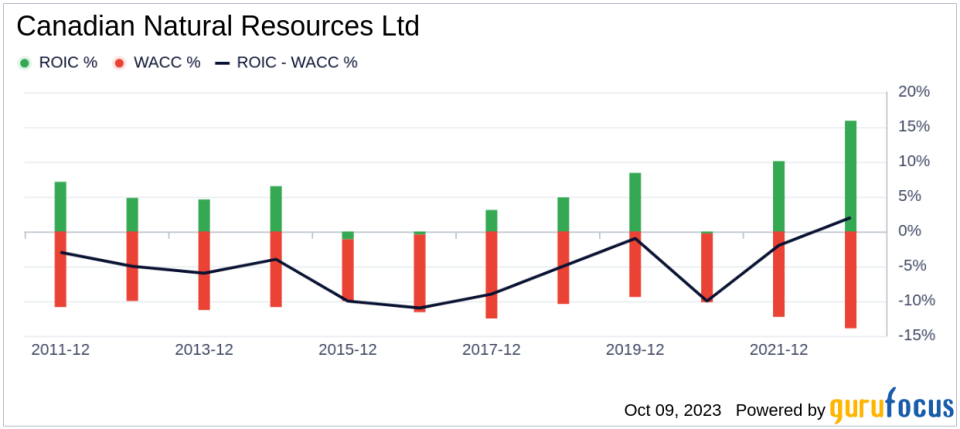
One can also evaluate a company's profitability by comparing its return on invested capital (ROIC) to its weighted average cost of capital (WACC). Return on invested capital (ROIC) measures how well a company generates cash flow relative to the capital it has invested in its business. The weighted average cost of capital (WACC) is the rate that a company is expected to pay on average to all its security holders to finance its assets. If the return on invested capital exceeds the weighted average cost of capital, the company is likely creating value for its shareholders. During the past 12 months, Canadian Natural Resources's ROIC is 11.26 while its WACC came in at 14.24.
Conclusion
In conclusion, the stock of Canadian Natural Resources (NYSE:CNQ) is estimated to be modestly overvalued. The company's financial condition is fair and its profitability is fair. Its growth ranks better than 62.65% of 822 companies in the Oil & Gas industry. To learn more about Canadian Natural Resources stock, you can check out its 30-Year Financials here.
To find out the high quality companies that may deliver above average returns, please check out GuruFocus High Quality Low Capex Screener.
This article, generated by GuruFocus, is designed to provide general insights and is not tailored financial advice. Our commentary is rooted in historical data and analyst projections, utilizing an impartial methodology, and is not intended to serve as specific investment guidance. It does not formulate a recommendation to purchase or divest any stock and does not consider individual investment objectives or financial circumstances. Our objective is to deliver long-term, fundamental data-driven analysis. Be aware that our analysis might not incorporate the most recent, price-sensitive company announcements or qualitative information. GuruFocus holds no position in the stocks mentioned herein.
This article first appeared on GuruFocus.
