Cancom SE (ETR:COK) Stock's On A Decline: Are Poor Fundamentals The Cause?
With its stock down 7.1% over the past three months, it is easy to disregard Cancom (ETR:COK). Given that stock prices are usually driven by a company’s fundamentals over the long term, which in this case look pretty weak, we decided to study the company's key financial indicators. Particularly, we will be paying attention to Cancom's ROE today.
Return on Equity or ROE is a test of how effectively a company is growing its value and managing investors’ money. In short, ROE shows the profit each dollar generates with respect to its shareholder investments.
Check out our latest analysis for Cancom
How To Calculate Return On Equity?
The formula for return on equity is:
Return on Equity = Net Profit (from continuing operations) ÷ Shareholders' Equity
So, based on the above formula, the ROE for Cancom is:
4.5% = €32m ÷ €705m (Based on the trailing twelve months to March 2023).
The 'return' is the income the business earned over the last year. So, this means that for every €1 of its shareholder's investments, the company generates a profit of €0.05.
What Has ROE Got To Do With Earnings Growth?
So far, we've learned that ROE is a measure of a company's profitability. Based on how much of its profits the company chooses to reinvest or "retain", we are then able to evaluate a company's future ability to generate profits. Generally speaking, other things being equal, firms with a high return on equity and profit retention, have a higher growth rate than firms that don’t share these attributes.
A Side By Side comparison of Cancom's Earnings Growth And 4.5% ROE
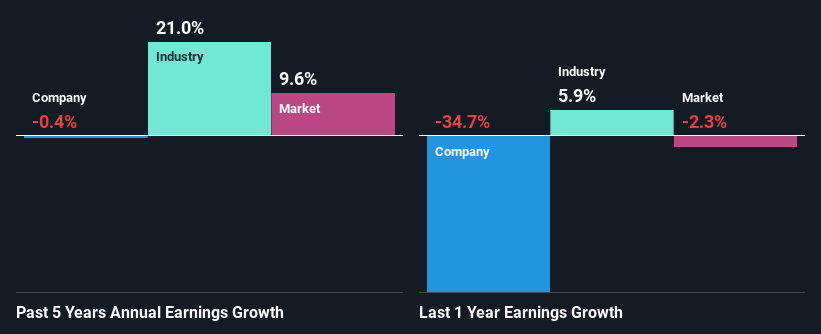
At first glance, Cancom's ROE doesn't look very promising. Next, when compared to the average industry ROE of 12%, the company's ROE leaves us feeling even less enthusiastic. As a result, Cancom's flat net income growth over the past five years doesn't come as a surprise given its lower ROE.
Next, on comparing with the industry net income growth, we found that the industry grew its earnings by 21% over the last few years.
The basis for attaching value to a company is, to a great extent, tied to its earnings growth. It’s important for an investor to know whether the market has priced in the company's expected earnings growth (or decline). By doing so, they will have an idea if the stock is headed into clear blue waters or if swampy waters await. Has the market priced in the future outlook for COK? You can find out in our latest intrinsic value infographic research report.
Is Cancom Efficiently Re-investing Its Profits?
Cancom has a high three-year median payout ratio of 80% (or a retention ratio of 20%), meaning that the company is paying most of its profits as dividends to its shareholders. This does go some way in explaining why there's been no growth in its earnings.
Additionally, Cancom has paid dividends over a period of at least ten years, which means that the company's management is determined to pay dividends even if it means little to no earnings growth. Our latest analyst data shows that the future payout ratio of the company is expected to drop to 62% over the next three years. As a result, the expected drop in Cancom's payout ratio explains the anticipated rise in the company's future ROE to 8.1%, over the same period.
Conclusion
On the whole, Cancom's performance is quite a big let-down. As a result of its low ROE and lack of much reinvestment into the business, the company has seen a disappointing earnings growth rate. With that said, we studied the latest analyst forecasts and found that while the company has shrunk its earnings in the past, analysts expect its earnings to grow in the future. Are these analysts expectations based on the broad expectations for the industry, or on the company's fundamentals? Click here to be taken to our analyst's forecasts page for the company.
Have feedback on this article? Concerned about the content? Get in touch with us directly. Alternatively, email editorial-team (at) simplywallst.com.
This article by Simply Wall St is general in nature. We provide commentary based on historical data and analyst forecasts only using an unbiased methodology and our articles are not intended to be financial advice. It does not constitute a recommendation to buy or sell any stock, and does not take account of your objectives, or your financial situation. We aim to bring you long-term focused analysis driven by fundamental data. Note that our analysis may not factor in the latest price-sensitive company announcements or qualitative material. Simply Wall St has no position in any stocks mentioned.
Join A Paid User Research Session
You’ll receive a US$30 Amazon Gift card for 1 hour of your time while helping us build better investing tools for the individual investors like yourself. Sign up here
