Capital City Bank Group, Inc. Reports First Quarter 2023 Results

Deposit Franchise
Liquidity
Investments
Capital
TALLAHASSEE, Fla., April 24, 2023 (GLOBE NEWSWIRE) -- Capital City Bank Group, Inc. (NASDAQ: CCBG) today reported net income attributable to common shareowners of $15.0 million, or $0.88 per diluted share, for the first quarter of 2023 compared to $11.7 million, or $0.68 per diluted share, for the fourth quarter of 2022, and $8.5 million, or $0.50 per diluted share, for the first quarter of 2022.
QUARTER HIGHLIGHTS (1st Quarter 2023 versus 4th Quarter 2022)
Strong growth in net interest income of 6% - net interest margin percentage grew 28 basis points to 4.04% - deposit interest expense was well controlled at 26 basis points (total deposits) and 46 basis points (interest bearing deposits)
Loan growth of $143 million, or 5.9% (average) and $112 million, or 4.4% (end of period)
Average quarterly deposit growth of $14 million, or 0.4%, and a decline of $115 million, or 2.9%, in period end balance, which reflected a normal seasonal reduction of $88 million in public fund balances
Continued strong credit quality metrics – allowance coverage ratio increased to 1.01%
Noninterest income increased $1.3 million, or 6.1%, due to higher mortgage banking revenues at Capital City Home Loans (“CCHL”)
Noninterest expense decreased $1.8 million, or 4.3%, and reflected no pension settlement expense for the quarter compared to $1.8 million for the prior quarter – expenses (excluding pension settlement expense) were favorably impacted by a $1.8 million gain from the sale of a banking office that was offset by higher payroll taxes (annual re-set), performance-based compensation, and the addition of two new offices during the first quarter
Tangible book value per share increased $1.00, or 5.7%, primarily due to strong earnings and a favorable valuation adjustment for available for sale securities
“The strength and flexibility of our balance sheet – particularly the diversity and granularity of our core deposit franchise – was evident during a volatile quarter for the industry,” said William G. Smith, Jr., Chairman, President, and CEO of Capital City Bank Group. “Continued margin expansion and loan growth were the primary drivers of our strong performance, which resulted in tangible book value per share growth of 5.7%. While there remains uncertainty around the possibility of a near-term recession or economic slowing, I feel good about our positioning and optimistic about our full-year performance.”
Discussion of Operating Results
Net Interest Income/Net Interest Margin
Tax-equivalent net interest income for the first quarter of 2023 totaled $40.5 million, compared to $38.2 million for the fourth quarter of 2022, and $24.8 million for the first quarter of 2022. Compared to both prior periods, the increase reflected strong loan growth and higher interest rates across a majority of our earning assets, partially offset by higher deposit costs.
Our net interest margin for the first quarter of 2023 was 4.04%, an increase of 28 basis points over the fourth quarter of 2022 and 149 basis points over the first quarter of 2022, both driven by higher interest rates and an overall improved earning asset mix. For the first quarter of 2023, our cost of funds was 35 basis points, an increase of four basis points over the fourth quarter of 2022 and 27 basis points over the first quarter of 2022. Our cost of interest-bearing deposits was 46 basis points, 35 basis points, and 4 basis points, respectively, for the same periods. Our total cost of deposits (including noninterest bearing accounts) was 26 basis points, 20 basis points, and 2 basis points, respectively, for the same periods.
Provision for Credit Losses
We recorded a provision for credit losses of $3.1 million for the first quarter of 2023 compared to $3.5 million for the fourth quarter of 2022 and no provision for the first quarter of 2022. The decrease in the provision compared to the fourth quarter of 2022 was primarily attributable to a lower level of loan growth. The credit loss provision for the first quarter of 2022 generally reflected lower required reserves needed post-pandemic. We discuss the allowance for credit losses further below.
Noninterest Income and Noninterest Expense
Noninterest income for the first quarter of 2023 totaled $22.2 million compared to $21.0 million for the fourth quarter of 2022 and $25.8 million for the first quarter of 2022. The $1.2 million increase over the fourth quarter of 2022 was primarily attributable to higher mortgage banking revenues at CCHL of $1.5 million partially offset by lower deposit fees $0.3 million. The increase in mortgage banking revenues reflected a higher level of rate locks and gain on sale margin. The decrease in deposit fees was partially attributable to two less processing days in the first quarter. Compared to the first quarter of 2022, the $3.6 million decrease reflected lower wealth management fees of $2.1 million and mortgage banking revenues of $1.9 million, partially offset by higher other income of $0.5 million. The decrease in wealth management fees was due to lower insurance commission revenues which reflected higher than normal revenues in the first quarter of 2022 related to the closing of several large insurance policies. The decline in mortgage banking revenues was attributable to a lower level of rate locks and gain on sale margin. Additional information on our mortgage banking operation is provided in our first quarter investor presentation. The increase in other income was primarily due to higher loan servicing income and miscellaneous income.
Noninterest expense for the first quarter of 2023 totaled $40.5 million compared to $42.3 million for the fourth quarter of 2022 and $39.2 million for the first quarter of 2022. Compared to the fourth quarter of 2022, the $1.8 million decrease reflected lower other expense of $2.4 million that was partially offset by an increase in occupancy expense of $0.5 million and compensation expense of $0.1 million. The reduction in other expense reflected lower other real estate expense of $1.6 million which was due to a $1.8 million gain from the sale of a banking office. Further, pension expense (non-service-related component) for the first quarter of 2023 totaled $0.2 million compared to $1.1 million for the fourth quarter of 2022 which included a $1.8 million pension settlement charge. The increase in occupancy expense reflected higher expenses related to three recently opened full-service offices and the re-location of one office. The slight increase in compensation expense reflected an increase in salary expense of $0.5 million due to higher payroll taxes (annual re-set) that was partially offset by a decrease in associate benefit expense of $0.4 million due to lower pension plan service cost. Compared to the first quarter of 2022, the $1.3 million increase reflected increases in compensation expense of $0.8 million and occupancy expense of $0.7 million that were partially off by a decrease in other expense of $0.2 million. The increase in compensation expense reflected an increase of $1.0 million in salary expense that was partially offset by a $0.2 million decrease in associate benefit expense. The addition of banking offices and staffing in new markets drove the variance in salary and occupancy expenses. The decrease in associate benefit expense was primarily due to a decrease in pension service cost of $0.7 million that was partially offset by an increase in stock-based compensation expense of $0.4 million.
Income Taxes
We realized income tax expense of $4.1 million (effective rate of 21.7%) for the first quarter of 2023 compared to $2.6 million (effective rate of 19.6%) for the fourth quarter of 2022 and $2.2 million (effective rate of 19.8%) for the first quarter of 2022. A discrete tax item of $0.4 million related our SERP plan favorably impacted the effective tax rate for the fourth quarter of 2022. Absent discrete items, we expect our annual effective tax rate to approximate 21%-22% in 2023. The increase in the effective tax rate for 2023 reflects a lower level of pre-tax income from CCHL in relation to our consolidated income as the non-controlling interest adjustment for CCHL is accounted for as a permanent tax adjustment.
Discussion of Financial Condition
Earning Assets
Average earning assets totaled $4.063 billion for the first quarter of 2023, an increase of $30.0 million, or 0.7%, over the fourth quarter of 2022, and an increase of $123.9 million, or 3.1%, over the first quarter of 2022. The increase over both prior periods was primarily driven by higher deposit balances (see below – Funding). The mix of earning assets continues to improve driven by strong loan growth.
Average loans held for investment (“HFI”) increased $143.0 million, or 5.9%, over the fourth quarter of 2022 and $618.8 million, or 31.5%, over the first quarter of 2022. Period end loans increased $111.7 million, or 4.4%, over the fourth quarter of 2022 and $651.4 million, or 32.8%, over the first quarter of 2022. Compared to the fourth quarter of 2022, a majority of the increase was realized in the residential real estate category, and to a lesser extent, the construction and commercial real estate mortgage categories. Compared to the first quarter of 2022, loan growth was broad based, with increases realized in all categories except consumer loans.
Allowance for Credit Losses
At March 31, 2023, the allowance for credit losses for HFI loans totaled $26.5 million compared to $24.7 million at December 31, 2022 and $20.8 million at March 31, 2022. Activity within the allowance is provided on Page 9. The increase in the allowance was driven primarily by loan growth. At March 31, 2023, the allowance represented 1.01% of HFI loans compared to 0.98% at December 31, 2022, and 1.05% at March 31, 2022.
Credit Quality
Overall credit quality remains stable. Nonperforming assets (nonaccrual loans and other real estate) totaled $4.6 million at March 31, 2023 compared to $2.7 million at December 31, 2022 and $2.7 million at March 31, 2022. At March 31, 2023, the increase was primarily due to the addition of one large business loan relationship totaling $1.8 million to nonaccrual status – it is in the process of collection and is adequately secured and reserved for. At March 31, 2023, nonperforming assets as a percent of total assets equaled 0.10%, compared to 0.06% at December 31, 2022 and 0.06% at March 31, 2022. Nonaccrual loans totaled $4.6 million at March 31, 2023, a $2.3 million increase over December 31, 2022 and a $1.9 million increase over March 31, 2022. Further, classified loans totaled $12.2 million at March 31, 2023, a $7.2 million decrease from December 31, 2022 and a $10.2 million decrease from March 31, 2022.
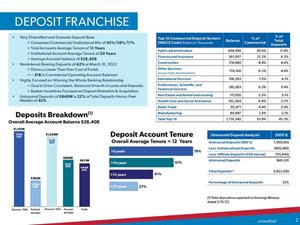
Deposits
Average total deposits were $3.817 billion for the first quarter of 2023, an increase of $14.3 million, or 0.4%, over the fourth quarter of 2022 and $103.3 million, or 2.8%, over the first quarter of 2022. Compared to the fourth quarter of 2022, the increase reflected higher NOW account balances, primarily due to a seasonal increase in our public fund deposits that occurred late in the fourth quarter of 2022. Compared to the first quarter of 2022, we experienced strong growth in our NOW accounts, and to a lesser degree, our savings accounts.
Period end total deposits declined $115.4 million from the fourth quarter of 2022, and reflected lower balances in noninterest bearing accounts, NOW accounts, and savings accounts, partially offset by slight growth in money market accounts and certificates of deposit. The $52.2 million decline in noninterest bearing accounts was largely due to the migration of two large commercial clients to an interest-bearing NOW account, in addition to clients seeking a higher yielding investment account at Capital City Investments (approximately $30 million, predominantly higher balance clients). The $47.8 million decline in the NOW account balance was largely driven by an anticipated seasonal decline in public fund balances of $66 million, partially offset by the previously mentioned migration of two clients from noninterest bearing accounts. The $20.1 million decline in the savings account balance was primarily attributable to clients seeking higher yielding investment products outside the Bank. The $4.5 million increase in the money market account balance occurred also due to some migration from noninterest bearing accounts, in addition to growth in our new markets which offered a promotional rate. We continue to closely monitor our cost of deposits and deposit mix as we manage through this rising rate environment. Additional information on the profile of our deposit base is provided in a supplement (Exhibit 99.2) to this release.
Liquidity
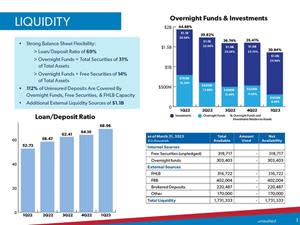
The Bank maintained an average net overnight funds (deposits with banks plus FED funds sold less FED funds purchased) sold position of $361.0 million in the first quarter of 2023 compared to $469.4 million in the fourth quarter of 2022. The declining overnight funds position reflected growth in average loans.
At March 31, 2023, we had the ability to generate approximately $1.428 billion (excludes overnight funds position of $303 million) in additional liquidity through various sources including various federal funds purchased lines, Federal Home Loan Bank borrowings, the Federal Reserve Discount Window, and through brokered deposits.
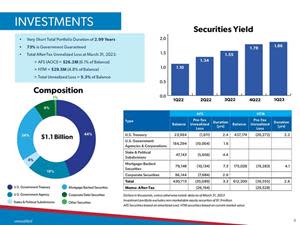
We also view our investment portfolio as a liquidity source and have the option to pledge securities in our portfolio as collateral for borrowings or deposits, and/or to sell selected securities. Our portfolio consists of debt issued by the U.S. Treasury, U.S. governmental agencies, municipal governments, and corporate entities. At March 31, 2023, the weighted-average maturity and duration of our portfolio were 3.34 years and 2.99 years, respectively, and the available-for-sale portfolio had a net unrealized pre-tax loss of $35.0 million.
Additional information on our liquidity and investment portfolio is included in a supplement (Exhibit 99.2) to this release.
Capital
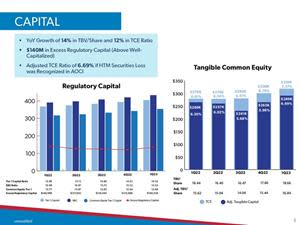
Shareowners’ equity was $411.2 million at March 31, 2023 compared to $394.0 million at December 31, 2022 and $372.1 million at March 31, 2022. For the first three months of 2023, shareowners’ equity was positively impacted by net income attributable to common shareowners of $15.0 million, a $5.6 million decrease in the unrealized loss on investment securities, the issuance of stock of $1.8 million, and stock compensation accretion of $0.5 million. Shareowners’ equity was reduced by common stock dividends of $3.1 million ($0.18 per share), the repurchase of stock of $0.8 million (25,000 shares), net adjustments totaling $1.2 million related to transactions under our stock compensation plans, and a $0.6 million decrease in the fair value of the interest rate swap related to subordinated debt.
At March 31, 2023, our total risk-based capital ratio was 15.53% compared to 15.52% at December 31, 2022 and 16.98% at March 31, 2022. Our common equity tier 1 capital ratio was 12.68%, 12.64%, and 13.77%, respectively, on these dates. Our leverage ratio was 9.28%, 9.06%, and 8.78%, respectively, on these dates. At March 31, 2023, all our regulatory capital ratios exceeded the threshold to be designated as “well-capitalized” under the Basel III capital standards. Further, our tangible common equity ratio was 7.37% at March 31, 2023 compared to 6.79% and 6.61% at December 31, 2022 and March 31, 2022, respectively. If our unrealized HTM securities losses of $29.5 million (after-tax) were recognized in accumulated other comprehensive loss, our adjusted tangible capital ratio would be 6.69%.
About Capital City Bank Group, Inc.
Capital City Bank Group, Inc. (NASDAQ: CCBG) is one of the largest publicly traded financial holding companies headquartered in Florida and has approximately $4.4 billion in assets. We provide a full range of banking services, including traditional deposit and credit services, mortgage banking, asset management, trust, merchant services, bankcards, securities brokerage services and financial advisory services, including the sale of life insurance, risk management and asset protection services. Our bank subsidiary, Capital City Bank, was founded in 1895 and now has 58 banking offices and 101 ATMs/ITMs in Florida, Georgia and Alabama. For more information about Capital City Bank Group, Inc., visit www.ccbg.com.
FORWARD-LOOKING STATEMENTS
Forward-looking statements in this Press Release are based on current plans and expectations that are subject to uncertainties and risks, which could cause our future results to differ materially. The words “may,” “could,” “should,” “would,” “believe,” “anticipate,” “estimate,” “expect,” “intend,” “plan,” “target,” “vision,” “goal,” and similar expressions are intended to identify forward-looking statements. The following factors, among others, could cause our actual results to differ: our ability to successfully manage credit risk, interest rate risk, liquidity risk, and other risks inherent to our industry; legislative or regulatory changes; adverse developments in the financial services industry generally, such as the recent bank failures and any related impact on depositor behavior; the effects of changes in the level of checking or savings account deposits and the competition for deposits on our funding costs, net interest margin and ability to replace maturing deposits and advances, as necessary; the effects of actions taken by governmental agencies to stabilize the financial system and the effectiveness of such actions; changes in monetary and fiscal policies of the U.S. Government; inflation, interest rate, market and monetary fluctuations; the effects of security breaches and computer viruses that may affect our computer systems or fraud related to debit card products; the accuracy of our financial statement estimates and assumptions, including the estimates used for our allowance for credit losses, deferred tax asset valuation and pension plan; changes in our liquidity position; changes in accounting principles, policies, practices or guidelines; the frequency and magnitude of foreclosure of our loans; the effects of our lack of a diversified loan portfolio, including the risks of loan segments, geographic and industry concentrations; the strength of the United States economy in general and the strength of the local economies in which we conduct operations; our ability to declare and pay dividends, the payment of which is subject to our capital requirements; changes in the securities and real estate markets; structural changes in the markets for origination, sale and servicing of residential mortgages; uncertainty in the pricing of residential mortgage loans that we sell, as well as competition for the mortgage servicing rights related to these loans and related interest rate risk or price risk resulting from retaining mortgage servicing rights and the potential effects of higher interest rates on our loan origination volumes; the effect of corporate restructuring, acquisitions or dispositions, including the actual restructuring and other related charges and the failure to achieve the expected gains, revenue growth or expense savings from such corporate restructuring, acquisitions or dispositions; the effects of natural disasters, harsh weather conditions (including hurricanes), widespread health emergencies (including pandemics, such as the COVID-19 pandemic), military conflict, terrorism, civil unrest or other geopolitical events; our ability to comply with the extensive laws and regulations to which we are subject, including the laws for each jurisdiction where we operate; the willingness of clients to accept third-party products and services rather than our products and services and vice versa; increased competition and its effect on pricing; technological changes; the outcomes of litigation or regulatory proceedings; negative publicity and the impact on our reputation; changes in consumer spending and saving habits; growth and profitability of our noninterest income; the limited trading activity of our common stock; the concentration of ownership of our common stock; anti-takeover provisions under federal and state law as well as our Articles of Incorporation and our Bylaws; other risks described from time to time in our filings with the Securities and Exchange Commission; and our ability to manage the risks involved in the foregoing. Additional factors can be found in our Annual Report on Form 10-K for the fiscal year ended December 31, 2022, and our other filings with the SEC, which are available at the SEC’s internet site (http://www.sec.gov). Forward-looking statements in this Press Release speak only as of the date of the Press Release, and we assume no obligation to update forward-looking statements or the reasons why actual results could differ.
USE OF NON-GAAP FINANCIAL MEASURES
Unaudited
We present a tangible common equity ratio and a tangible book value per diluted share that removes the effect of goodwill and other intangibles resulting from merger and acquisition activity. We believe these measures are useful to investors because it allows investors to more easily compare our capital adequacy to other companies in the industry.
The GAAP to non-GAAP reconciliations are provided below.
(Dollars in Thousands, except per share data) | Mar 31, 2023 | Dec 31, 2022 | Sep 30, 2022 | Jun 30, 2022 | Mar 31, 2022 | |||||||||||
Shareowners' Equity (GAAP) |
| $ | 411,240 |
| $ | 394,016 |
| $ | 373,165 |
| $ | 371,675 |
| $ | 372,145 |
|
Less: Goodwill and Other Intangibles (GAAP) |
|
| 93,053 |
|
| 93,093 |
|
| 93,133 |
|
| 93,173 |
|
| 93,213 |
|
Tangible Shareowners' Equity (non-GAAP) | A |
| 318,187 |
|
| 300,923 |
|
| 280,032 |
|
| 278,502 |
|
| 278,932 |
|
Total Assets (GAAP) |
|
| 4,409,742 |
|
| 4,525,958 |
|
| 4,332,671 |
|
| 4,354,297 |
|
| 4,310,045 |
|
Less: Goodwill and Other Intangibles (GAAP) |
|
| 93,053 |
|
| 93,093 |
|
| 93,133 |
|
| 93,173 |
|
| 93,213 |
|
Tangible Assets (non-GAAP) | B | $ | 4,316,689 |
| $ | 4,432,865 |
| $ | 4,239,538 |
| $ | 4,261,124 |
| $ | 4,216,832 |
|
Tangible Common Equity Ratio (non-GAAP) | A/B |
| 7.37 | % |
| 6.79 | % |
| 6.61 | % |
| 6.54 | % |
| 6.61 | % |
Actual Diluted Shares Outstanding (GAAP) | C |
| 17,049,913 |
|
| 17,039,401 |
|
| 16,998,177 |
|
| 16,981,614 |
|
| 16,962,362 |
|
Tangible Book Value per Diluted Share (non-GAAP) | A/C | $ | 18.66 |
| $ | 17.66 |
| $ | 16.47 |
| $ | 16.40 |
| $ | 16.44 |
|
CAPITAL CITY BANK GROUP, INC. |
|
|
|
|
|
|
|
EARNINGS HIGHLIGHTS |
|
|
|
|
|
|
|
Unaudited |
|
|
|
|
|
|
|
|
|
|
|
|
|
|
|
|
| Three Months Ended |
| ||||
(Dollars in thousands, except per share data) |
| Mar 31, 2023 |
| Dec 31, 2022 |
| Mar 31, 2022 |
|
EARNINGS |
|
|
|
|
|
|
|
Net Income Attributable to Common Shareowners | $ | 14,954 | $ | 11,664 | $ | 8,455 |
|
Diluted Net Income Per Share | $ | 0.88 | $ | 0.68 | $ | 0.50 |
|
PERFORMANCE |
|
|
|
|
|
|
|
Return on Average Assets |
| 1.37 | % | 1.06 | % | 0.80 | % |
Return on Average Equity |
| 15.01 |
| 12.16 |
| 8.93 |
|
Net Interest Margin |
| 4.04 |
| 3.76 |
| 2.55 |
|
Noninterest Income as % of Operating Revenue |
| 35.52 |
| 35.50 |
| 51.11 |
|
Efficiency Ratio |
| 64.48 | % | 71.47 | % | 77.55 | % |
CAPITAL ADEQUACY |
|
|
|
|
|
|
|
Tier 1 Capital |
| 14.51 | % | 14.53 | % | 15.98 | % |
Total Capital |
| 15.53 |
| 15.52 |
| 16.98 |
|
Leverage |
| 9.28 |
| 9.06 |
| 8.78 |
|
Common Equity Tier 1 |
| 12.68 |
| 12.64 |
| 13.77 |
|
Tangible Common Equity(1) |
| 7.37 |
| 6.79 |
| 6.61 |
|
Equity to Assets |
| 9.33 | % | 8.71 | % | 8.63 | % |
ASSET QUALITY |
|
|
|
|
|
|
|
Allowance as % of Non-Performing Loans |
| 577.63 | % | 1,076.89 | % | 760.83 | % |
Allowance as a % of Loans HFI |
| 1.01 |
| 0.98 |
| 1.05 |
|
Net Charge-Offs as % of Average Loans HFI |
| 0.24 |
| 0.21 |
| 0.16 |
|
Nonperforming Assets as % of Loans HFI and OREO |
| 0.17 |
| 0.11 |
| 0.14 |
|
Nonperforming Assets as % of Total Assets |
| 0.10 | % | 0.06 | % | 0.06 | % |
STOCK PERFORMANCE |
|
|
|
|
|
|
|
High | $ | 36.86 | $ | 36.23 | $ | 28.88 |
|
Low |
| 28.18 |
| 31.14 |
| 25.96 |
|
Close | $ | 29.31 | $ | 32.50 | $ | 26.36 |
|
Average Daily Trading Volume |
| 41,737 |
| 31,894 |
| 24,019 |
|
|
|
|
|
|
|
|
|
(1)Tangible common equity ratio is a non-GAAP financial measure. For additional information, including a reconciliation to GAAP, refer to Page 5. | |||||||
|
|
|
|
|
|
|
|
CAPITAL CITY BANK GROUP, INC. |
|
|
|
|
|
|
|
|
|
| |||||
CONSOLIDATED STATEMENT OF FINANCIAL CONDITION |
|
|
|
|
|
| |||||||||
Unaudited |
|
|
|
|
|
|
|
|
|
| |||||
|
|
|
|
|
|
|
|
|
|
| |||||
| 2023 |
|
| 2022 |
| ||||||||||
(Dollars in thousands) | First Quarter |
| Fourth Quarter |
| Third Quarter |
| Second Quarter |
| First Quarter | ||||||
ASSETS |
|
|
|
|
|
|
|
|
|
| |||||
Cash and Due From Banks | $ | 84,549 |
| $ | 72,114 |
| $ | 72,686 |
| $ | 91,209 |
| $ | 77,963 |
|
Funds Sold and Interest Bearing Deposits |
| 303,403 |
|
| 528,536 |
|
| 497,679 |
|
| 603,315 |
|
| 790,465 |
|
Total Cash and Cash Equivalents |
| 387,952 |
|
| 600,650 |
|
| 570,365 |
|
| 694,524 |
|
| 868,428 |
|
|
|
|
|
|
|
|
|
|
|
| |||||
Investment Securities Available for Sale |
| 402,943 |
|
| 413,294 |
|
| 416,745 |
|
| 601,405 |
|
| 624,361 |
|
Investment Securities Held to Maturity |
| 651,755 |
|
| 660,744 |
|
| 676,178 |
|
| 528,258 |
|
| 518,678 |
|
Other Equity Securities |
| 1,883 |
|
| 10 |
|
| 1,349 |
|
| 900 |
|
| 855 |
|
Total Investment Securities |
| 1,056,581 |
|
| 1,074,048 |
|
| 1,094,272 |
|
| 1,130,563 |
|
| 1,143,894 |
|
|
|
|
|
|
|
|
|
|
|
| |||||
Loans Held for Sale |
| 55,118 |
|
| 54,635 |
|
| 50,304 |
|
| 48,708 |
|
| 50,815 |
|
|
|
|
|
|
|
|
|
|
|
| |||||
Loans Held for Investment ("HFI"): |
|
|
|
|
|
|
|
|
|
| |||||
Commercial, Financial, & Agricultural |
| 236,263 |
|
| 247,362 |
|
| 246,304 |
|
| 247,902 |
|
| 230,213 |
|
Real Estate - Construction |
| 253,903 |
|
| 234,519 |
|
| 237,718 |
|
| 225,664 |
|
| 174,293 |
|
Real Estate - Commercial |
| 798,438 |
|
| 782,557 |
|
| 715,870 |
|
| 699,093 |
|
| 669,110 |
|
Real Estate - Residential |
| 827,124 |
|
| 721,759 |
|
| 573,963 |
|
| 478,121 |
|
| 368,020 |
|
Real Estate - Home Equity |
| 207,241 |
|
| 208,120 |
|
| 202,512 |
|
| 194,658 |
|
| 188,174 |
|
Consumer |
| 305,324 |
|
| 324,450 |
|
| 347,949 |
|
| 359,906 |
|
| 347,785 |
|
Other Loans |
| 7,660 |
|
| 5,346 |
|
| 20,822 |
|
| 6,854 |
|
| 6,692 |
|
Overdrafts |
| 931 |
|
| 1,067 |
|
| 1,047 |
|
| 1,455 |
|
| 1,222 |
|
Total Loans Held for Investment |
| 2,636,884 |
|
| 2,525,180 |
|
| 2,346,185 |
|
| 2,213,653 |
|
| 1,985,509 |
|
Allowance for Credit Losses |
| (26,507 | ) |
| (24,736 | ) |
| (22,510 | ) |
| (21,281 | ) |
| (20,756 | ) |
Loans Held for Investment, Net |
| 2,610,377 |
|
| 2,500,444 |
|
| 2,323,675 |
|
| 2,192,372 |
|
| 1,964,753 |
|
|
|
|
|
|
|
|
|
|
|
| |||||
Premises and Equipment, Net |
| 82,055 |
|
| 82,138 |
|
| 81,736 |
|
| 82,932 |
|
| 82,518 |
|
Goodwill and Other Intangibles |
| 93,053 |
|
| 93,093 |
|
| 93,133 |
|
| 93,173 |
|
| 93,213 |
|
Other Real Estate Owned |
| 13 |
|
| 431 |
|
| 13 |
|
| 90 |
|
| 17 |
|
Other Assets |
| 124,593 |
|
| 120,519 |
|
| 119,173 |
|
| 111,935 |
|
| 106,407 |
|
Total Other Assets |
| 299,714 |
|
| 296,181 |
|
| 294,055 |
|
| 288,130 |
|
| 282,155 |
|
Total Assets | $ | 4,409,742 |
| $ | 4,525,958 |
| $ | 4,332,671 |
| $ | 4,354,297 |
| $ | 4,310,045 |
|
LIABILITIES |
|
|
|
|
|
|
|
|
|
| |||||
Deposits: |
|
|
|
|
|
|
|
|
|
| |||||
Noninterest Bearing Deposits | $ | 1,601,388 |
| $ | 1,653,620 |
| $ | 1,737,046 |
| $ | 1,724,671 |
| $ | 1,704,329 |
|
NOW Accounts |
| 1,242,721 |
|
| 1,290,494 |
|
| 990,021 |
|
| 1,036,757 |
|
| 1,062,498 |
|
Money Market Accounts |
| 271,880 |
|
| 267,383 |
|
| 292,932 |
|
| 289,337 |
|
| 288,877 |
|
Savings Accounts |
| 617,310 |
|
| 637,374 |
|
| 646,526 |
|
| 639,594 |
|
| 614,599 |
|
Certificates of Deposit |
| 90,621 |
|
| 90,446 |
|
| 92,853 |
|
| 95,899 |
|
| 95,204 |
|
Total Deposits |
| 3,823,920 |
|
| 3,939,317 |
|
| 3,759,378 |
|
| 3,786,258 |
|
| 3,765,507 |
|
|
|
|
|
|
|
|
|
|
|
| |||||
Short-Term Borrowings |
| 26,632 |
|
| 56,793 |
|
| 52,271 |
|
| 39,463 |
|
| 30,865 |
|
Subordinated Notes Payable |
| 52,887 |
|
| 52,887 |
|
| 52,887 |
|
| 52,887 |
|
| 52,887 |
|
Other Long-Term Borrowings |
| 463 |
|
| 513 |
|
| 562 |
|
| 612 |
|
| 806 |
|
Other Liabilities |
| 85,878 |
|
| 73,675 |
|
| 84,657 |
|
| 93,319 |
|
| 77,323 |
|
Total Liabilities |
| 3,989,780 |
|
| 4,123,185 |
|
| 3,949,755 |
|
| 3,972,539 |
|
| 3,927,388 |
|
|
|
|
|
|
|
|
|
|
|
| |||||
Temporary Equity |
| 8,722 |
|
| 8,757 |
|
| 9,751 |
|
| 10,083 |
|
| 10,512 |
|
SHAREOWNERS' EQUITY |
|
|
|
|
|
|
|
|
|
| |||||
Common Stock |
| 170 |
|
| 170 |
|
| 170 |
|
| 170 |
|
| 169 |
|
Additional Paid-In Capital |
| 37,512 |
|
| 37,331 |
|
| 36,234 |
|
| 35,738 |
|
| 35,188 |
|
Retained Earnings |
| 405,634 |
|
| 393,744 |
|
| 384,964 |
|
| 376,532 |
|
| 370,531 |
|
Accumulated Other Comprehensive Loss, Net of Tax |
| (32,076 | ) |
| (37,229 | ) |
| (48,203 | ) |
| (40,765 | ) |
| (33,743 | ) |
Total Shareowners' Equity |
| 411,240 |
|
| 394,016 |
|
| 373,165 |
|
| 371,675 |
|
| 372,145 |
|
Total Liabilities, Temporary Equity and Shareowners' Equity | $ | 4,409,742 |
| $ | 4,525,958 |
| $ | 4,332,671 |
| $ | 4,354,297 |
| $ | 4,310,045 |
|
OTHER BALANCE SHEET DATA |
|
|
|
|
|
|
|
|
|
| |||||
Earning Assets | $ | 4,051,987 |
| $ | 4,182,399 |
| $ | 3,988,440 |
| $ | 3,996,238 |
| $ | 3,970,684 |
|
Interest Bearing Liabilities |
| 2,302,514 |
|
| 2,395,890 |
|
| 2,128,052 |
|
| 2,154,549 |
|
| 2,145,736 |
|
Book Value Per Diluted Share | $ | 24.12 |
| $ | 23.12 |
| $ | 21.95 |
| $ | 21.89 |
| $ | 21.94 |
|
Tangible Book Value Per Diluted Share(1) |
| 18.66 |
|
| 17.66 |
|
| 16.47 |
|
| 16.40 |
|
| 16.44 |
|
Actual Basic Shares Outstanding |
| 17,022 |
|
| 16,987 |
|
| 16,962 |
|
| 16,959 |
|
| 16,948 |
|
Actual Diluted Shares Outstanding |
| 17,050 |
|
| 17,039 |
|
| 16,998 |
|
| 16,982 |
|
| 16,962 |
|
(1) Tangible book value per diluted share is a non-GAAP financial measure. For additional information, including a reconciliation to GAAP, refer to Page 5. | |||||||||||||||
|
|
|
|
|
|
|
|
|
|
| ||
CAPITAL CITY BANK GROUP, INC. |
|
|
|
|
|
|
|
|
|
| ||
CONSOLIDATED STATEMENT OF OPERATIONS |
|
|
|
|
|
|
| |||||
Unaudited |
|
|
|
|
|
|
|
|
|
| ||
|
|
|
|
|
|
|
|
|
|
| ||
|
| 2023 |
| 2022 |
| |||||||
(Dollars in thousands, except per share data) |
| First Quarter |
| Fourth Quarter |
| Third Quarter |
| Second Quarter |
| First Quarter | ||
INTEREST INCOME |
|
|
|
|
|
|
|
|
|
| ||
Loans, including Fees | $ | 34,880 | $ | 31,916 | $ | 27,761 | $ | 24,072 |
| $ | 22,133 |
|
Investment Securities |
| 4,924 |
| 4,847 |
| 4,372 |
| 3,840 |
|
| 2,896 |
|
Federal Funds Sold and Interest Bearing Deposits |
| 4,111 |
| 4,463 |
| 3,231 |
| 1,408 |
|
| 409 |
|
Total Interest Income |
| 43,915 |
| 41,226 |
| 35,364 |
| 29,320 |
|
| 25,438 |
|
INTEREST EXPENSE |
|
|
|
|
|
|
|
|
|
| ||
Deposits |
| 2,488 |
| 1,902 |
| 1,052 |
| 266 |
|
| 224 |
|
Short-Term Borrowings |
| 461 |
| 690 |
| 536 |
| 343 |
|
| 192 |
|
Subordinated Notes Payable |
| 571 |
| 522 |
| 443 |
| 370 |
|
| 317 |
|
Other Long-Term Borrowings |
| 6 |
| 8 |
| 6 |
| 8 |
|
| 9 |
|
Total Interest Expense |
| 3,526 |
| 3,122 |
| 2,037 |
| 987 |
|
| 742 |
|
Net Interest Income |
| 40,389 |
| 38,104 |
| 33,327 |
| 28,333 |
|
| 24,696 |
|
Provision for Credit Losses |
| 3,130 |
| 3,521 |
| 2,099 |
| 1,542 |
|
| - |
|
Net Interest Income after Provision for Credit Losses |
| 37,259 |
| 34,583 |
| 31,228 |
| 26,791 |
|
| 24,696 |
|
NONINTEREST INCOME |
|
|
|
|
|
|
|
|
|
| ||
Deposit Fees |
| 5,239 |
| 5,536 |
| 5,947 |
| 5,447 |
|
| 5,191 |
|
Bank Card Fees |
| 3,726 |
| 3,744 |
| 3,860 |
| 4,034 |
|
| 3,763 |
|
Wealth Management Fees |
| 3,928 |
| 3,649 |
| 3,937 |
| 4,403 |
|
| 6,070 |
|
Mortgage Banking Revenues |
| 6,995 |
| 5,497 |
| 7,116 |
| 9,065 |
|
| 8,946 |
|
Other |
| 2,360 |
| 2,546 |
| 2,074 |
| 1,954 |
|
| 1,848 |
|
Total Noninterest Income |
| 22,248 |
| 20,972 |
| 22,934 |
| 24,903 |
|
| 25,818 |
|
NONINTEREST EXPENSE |
|
|
|
|
|
|
|
|
|
| ||
Compensation |
| 25,636 |
| 25,565 |
| 24,738 |
| 25,383 |
|
| 24,856 |
|
Occupancy, Net |
| 6,762 |
| 6,253 |
| 6,153 |
| 6,075 |
|
| 6,093 |
|
Other |
| 8,057 |
| 10,469 |
| 8,919 |
| 9,040 |
|
| 8,284 |
|
Total Noninterest Expense |
| 40,455 |
| 42,287 |
| 39,810 |
| 40,498 |
|
| 39,233 |
|
OPERATING PROFIT |
| 19,052 |
| 13,268 |
| 14,352 |
| 11,196 |
|
| 11,281 |
|
Income Tax Expense |
| 4,133 |
| 2,599 |
| 3,074 |
| 2,177 |
|
| 2,235 |
|
Net Income |
| 14,919 |
| 10,669 |
| 11,278 |
| 9,019 |
|
| 9,046 |
|
Pre-Tax Loss (Income) Attributable to Noncontrolling Interest |
| 35 |
| 995 |
| 37 |
| (306 | ) |
| (591 | ) |
NET INCOME ATTRIBUTABLE TO | $ | 14,954 | $ | 11,664 | $ | 11,315 | $ | 8,713 |
| $ | 8,455 |
|
PER COMMON SHARE |
|
|
|
|
|
|
|
|
|
| ||
Basic Net Income | $ | 0.88 | $ | 0.69 | $ | 0.67 | $ | 0.51 |
| $ | 0.50 |
|
Diluted Net Income |
| 0.88 |
| 0.68 |
| 0.67 |
| 0.51 |
|
| 0.50 |
|
Cash Dividend | $ | 0.18 | $ | 0.17 | $ | 0.17 | $ | 0.16 |
| $ | 0.16 |
|
AVERAGE SHARES |
|
|
|
|
|
|
|
|
|
| ||
Basic |
| 17,016 |
| 16,963 |
| 16,960 |
| 16,949 |
|
| 16,931 |
|
Diluted |
| 17,045 |
| 17,016 |
| 16,996 |
| 16,971 |
|
| 16,946 |
|
CAPITAL CITY BANK GROUP, INC. |
|
|
|
|
|
|
|
|
|
| |||||
ALLOWANCE FOR CREDIT LOSSES ("ACL") |
|
|
|
|
|
|
|
| |||||||
AND CREDIT QUALITY |
|
|
|
|
|
|
|
|
|
| |||||
Unaudited |
|
|
|
|
|
|
|
|
|
| |||||
|
|
|
|
|
|
|
|
|
|
| |||||
|
| 2023 |
|
| 2022 |
| |||||||||
(Dollars in thousands, except per share data) |
| First Quarter |
| Fourth Quarter |
| Third Quarter |
| Second Quarter |
| First Quarter | |||||
ACL - HELD FOR INVESTMENT LOANS |
|
|
|
|
|
|
|
|
|
| |||||
Balance at Beginning of Period | $ | 24,736 |
| $ | 22,510 |
| $ | 21,281 |
| $ | 20,756 |
| $ | 21,606 |
|
Provision for Credit Losses |
| 3,291 |
|
| 3,543 |
|
| 1,931 |
|
| 1,670 |
|
| (79 | ) |
Net Charge-Offs (Recoveries) |
| 1,520 |
|
| 1,317 |
|
| 702 |
|
| 1,145 |
|
| 771 |
|
Balance at End of Period | $ | 26,507 |
| $ | 24,736 |
| $ | 22,510 |
| $ | 21,281 |
| $ | 20,756 |
|
As a % of Loans HFI |
| 1.01 | % |
| 0.98 | % |
| 0.96 | % |
| 0.96 | % |
| 1.05 | % |
As a % of Nonperforming Loans |
| 577.63 | % |
| 1,076.89 | % |
| 934.53 | % |
| 677.57 | % |
| 760.83 | % |
ACL - UNFUNDED COMMITMENTS |
|
|
|
|
|
|
|
|
|
| |||||
Balance at Beginning of Period |
| 2,989 |
| $ | 3,012 |
| $ | 2,853 |
| $ | 2,976 |
| $ | 2,897 |
|
Provision for Credit Losses |
| (156 | ) |
| (23 | ) |
| 159 |
|
| (123 | ) |
| 79 |
|
Balance at End of Period(1) |
| 2,833 |
|
| 2,989 |
|
| 3,012 |
|
| 2,853 |
|
| 2,976 |
|
ACL - DEBT SECURITIES |
|
|
|
|
|
|
|
|
|
| |||||
Provision for Credit Losses | $ | (5 | ) | $ | 1 |
| $ | 9 |
| $ | (5 | ) | $ | - |
|
CHARGE-OFFS |
|
|
|
|
|
|
|
|
|
| |||||
Commercial, Financial and Agricultural | $ | 164 |
| $ | 129 |
| $ | 2 |
| $ | 1,104 |
| $ | 73 |
|
Real Estate - Commercial |
| 120 |
|
| 88 |
|
| 1 |
|
| - |
|
| 266 |
|
Real Estate - Home Equity |
| - |
|
| 160 |
|
| - |
|
| - |
|
| 33 |
|
Consumer |
| 1,732 |
|
| 976 |
|
| 770 |
|
| 533 |
|
| 622 |
|
Overdrafts |
| 634 |
|
| 720 |
|
| 989 |
|
| 660 |
|
| 780 |
|
Total Charge-Offs | $ | 2,650 |
| $ | 2,073 |
| $ | 1,762 |
| $ | 2,297 |
| $ | 1,774 |
|
RECOVERIES |
|
|
|
|
|
|
|
|
|
| |||||
Commercial, Financial and Agricultural | $ | 95 |
| $ | 25 |
| $ | 58 |
| $ | 59 |
| $ | 165 |
|
Real Estate - Construction |
| 1 |
|
| - |
|
| 2 |
|
| - |
|
| 8 |
|
Real Estate - Commercial |
| 8 |
|
| 13 |
|
| 8 |
|
| 56 |
|
| 29 |
|
Real Estate - Residential |
| 57 |
|
| 98 |
|
| 44 |
|
| 115 |
|
| 27 |
|
Real Estate - Home Equity |
| 25 |
|
| 36 |
|
| 22 |
|
| 67 |
|
| 58 |
|
Consumer |
| 571 |
|
| 175 |
|
| 260 |
|
| 453 |
|
| 183 |
|
Overdrafts |
| 373 |
|
| 409 |
|
| 666 |
|
| 402 |
|
| 533 |
|
Total Recoveries | $ | 1,130 |
| $ | 756 |
| $ | 1,060 |
| $ | 1,152 |
| $ | 1,003 |
|
NET CHARGE-OFFS (RECOVERIES) | $ | 1,520 |
| $ | 1,317 |
| $ | 702 |
| $ | 1,145 |
| $ | 771 |
|
Net Charge-Offs as a % of Average Loans HFI(2) |
| 0.24 | % |
| 0.21 | % |
| 0.12 | % |
| 0.22 | % |
| 0.16 | % |
CREDIT QUALITY |
|
|
|
|
|
|
|
|
|
| |||||
Nonaccruing Loans | $ | 4,589 |
| $ | 2,297 |
| $ | 2,409 |
| $ | 3,141 |
| $ | 2,728 |
|
Other Real Estate Owned |
| 13 |
|
| 431 |
|
| 13 |
|
| 90 |
|
| 17 |
|
Total Nonperforming Assets ("NPAs") | $ | 4,602 |
| $ | 2,728 |
| $ | 2,422 |
| $ | 3,231 |
| $ | 2,745 |
|
|
|
|
|
|
|
|
|
|
|
| |||||
Past Due Loans 30-89 Days | $ | 5,061 |
| $ | 7,829 |
| $ | 6,263 |
| $ | 3,554 |
| $ | 3,120 |
|
Past Due Loans 90 Days or More |
| - |
|
| - |
|
| - |
|
| - |
|
| - |
|
Classified Loans |
| 12,179 |
|
| 19,342 |
|
| 20,988 |
|
| 19,620 |
|
| 22,348 |
|
|
|
|
|
|
|
|
|
|
|
| |||||
Nonperforming Loans as a % of Loans HFI |
| 0.17 | % |
| 0.09 | % |
| 0.10 | % |
| 0.14 | % |
| 0.14 | % |
NPAs as a % of Loans HFI and Other Real Estate |
| 0.17 | % |
| 0.11 | % |
| 0.10 | % |
| 0.15 | % |
| 0.14 | % |
NPAs as a % of Total Assets |
| 0.10 | % |
| 0.06 | % |
| 0.06 | % |
| 0.07 | % |
| 0.06 | % |
|
|
|
|
|
|
|
|
|
|
| |||||
(1) Recorded in other liabilities |
|
|
|
|
|
|
|
|
|
| |||||
(2) Annualized |
|
|
|
|
|
|
|
|
|
| |||||
CAPITAL CITY BANK GROUP, INC. |
|
|
|
|
|
|
|
|
|
|
|
|
|
|
|
|
|
|
|
|
|
|
|
|
|
|
|
|
|
| |||||||||||
AVERAGE BALANCE AND INTEREST RATES |
|
|
|
|
|
|
|
|
|
|
|
|
|
|
|
|
|
|
|
|
|
|
|
|
|
|
|
|
|
| |||||||||||
Unaudited |
|
|
|
|
|
|
|
|
|
|
|
|
|
|
|
|
|
|
|
|
|
|
|
|
|
|
|
|
|
|
|
|
|
|
|
| |||||
|
|
|
|
|
|
|
|
|
|
|
|
|
|
|
|
|
|
|
|
|
|
|
|
|
|
|
|
|
|
|
|
|
|
|
|
| |||||
|
| First Quarter 2023 |
|
| Fourth Quarter 2022 |
|
| Third Quarter 2022 |
|
| Second Quarter 2022 |
|
| First Quarter 2022 |
|
| |||||||||||||||||||||||||
(Dollars in thousands) |
| Average |
| Interest |
| Average |
|
| Average |
| Interest |
| Average |
|
| Average |
| Interest |
| Average |
|
| Average |
| Interest |
| Average |
|
| Average |
| Interest |
| Average |
|
| |||||
ASSETS: |
|
|
|
|
|
|
|
|
|
|
|
|
|
|
|
|
|
|
|
|
|
|
|
|
|
|
|
|
|
|
|
|
|
|
|
| |||||
Loans Held for Sale | $ | 55,110 |
| $ | 644 |
| 4.74 | % | $ | 42,910 |
| $ | 581 |
| 5.38 | % | $ | 55,164 |
| $ | 486 |
| 4.82 | % | $ | 52,860 |
|
| 711 |
| 4.44 | % | $ | 43,004 |
| $ | 397 |
| 3.19 | % |
|
Loans Held for Investment(1) |
| 2,582,395 |
|
| 34,331 |
| 5.39 |
|
| 2,439,379 |
|
| 31,418 |
| 5.11 |
|
| 2,264,075 |
|
| 27,354 |
| 4.76 |
|
| 2,084,679 |
|
| 23,433 |
| 4.53 |
|
| 1,963,578 |
|
| 21,811 |
| 4.52 |
|
|
|
|
|
|
|
|
|
|
|
|
|
|
|
|
|
|
|
|
|
|
|
|
|
|
|
|
|
|
|
|
|
|
|
|
|
|
| |||||
Investment Securities |
|
|
|
|
|
|
|
|
|
|
|
|
|
|
|
|
|
|
|
|
|
|
|
|
|
|
|
|
|
|
|
|
|
|
|
| |||||
Taxable Investment Securities |
| 1,061,372 |
|
| 4,912 |
| 1.86 |
|
| 1,078,265 |
|
| 4,835 |
| 1.78 |
|
| 1,117,789 |
|
| 4,359 |
| 1.55 |
|
| 1,142,269 |
|
| 3,834 |
| 1.34 |
|
| 1,056,736 |
|
| 2,889 |
| 1.10 |
|
|
Tax-Exempt Investment Securities(1) |
| 2,840 |
|
| 17 |
| 2.36 |
|
| 2,827 |
|
| 17 |
| 2.36 |
|
| 2,939 |
|
| 17 |
| 2.30 |
|
| 2,488 |
|
| 10 |
| 1.73 |
|
| 2,409 |
|
| 10 |
| 1.60 |
|
|
|
|
|
|
|
|
|
|
|
|
|
|
|
|
|
|
|
|
|
|
|
|
|
|
|
|
|
|
|
|
|
|
|
|
|
|
| |||||
Total Investment Securities |
| 1,064,212 |
|
| 4,929 |
| 1.86 |
|
| 1,081,092 |
|
| 4,852 |
| 1.78 |
|
| 1,120,728 |
|
| 4,376 |
| 1.55 |
|
| 1,144,757 |
|
| 3,844 |
| 1.34 |
|
| 1,059,145 |
|
| 2,899 |
| 1.10 |
|
|
|
|
|
|
|
|
|
|
|
|
|
|
|
|
|
|
|
|
|
|
|
|
|
|
|
|
|
|
|
|
|
|
|
|
|
|
| |||||
Federal Funds Sold and Interest Bearing Deposits |
| 360,971 |
|
| 4,111 |
| 4.62 |
|
| 469,352 |
|
| 4,463 |
| 3.77 |
|
| 569,984 |
|
| 3,231 |
| 2.25 |
|
| 691,925 |
|
| 1,408 |
| 0.82 |
|
| 873,097 |
|
| 409 |
| 0.19 |
|
|
|
|
|
|
|
|
|
|
|
|
|
|
|
|
|
|
|
|
|
|
|
|
|
|
|
|
|
|
|
|
|
|
|
|
|
|
| |||||
Total Earning Assets |
| 4,062,688 |
| $ | 44,015 |
| 4.39 | % |
| 4,032,733 |
| $ | 41,314 |
| 4.07 | % |
| 4,009,951 |
| $ | 35,447 |
| 3.51 | % |
| 3,974,221 |
| $ | 29,396 |
| 2.97 | % |
| 3,938,824 |
| $ | 25,516 |
| 2.63 | % |
|
|
|
|
|
|
|
|
|
|
|
|
|
|
|
|
|
|
|
|
|
|
|
|
|
|
|
|
|
|
|
|
|
|
|
|
|
| |||||
Cash and Due From Banks |
| 74,639 |
|
|
|
|
|
|
| 74,178 |
|
|
|
|
|
|
| 79,527 |
|
|
|
|
|
|
| 79,730 |
|
|
|
|
|
|
| 74,253 |
|
|
|
|
|
|
|
Allowance for Credit Losses |
| (25,637 | ) |
|
|
|
|
|
| (22,596 | ) |
|
|
|
|
|
| (21,509 | ) |
|
|
|
|
|
| (20,984 | ) |
|
|
|
|
|
| (21,655 | ) |
|
|
|
|
|
|
Other Assets |
| 300,175 |
|
|
|
|
|
|
| 297,510 |
|
|
|
|
|
|
| 289,709 |
|
|
|
|
|
|
| 288,421 |
|
|
|
|
|
|
| 275,353 |
|
|
|
|
|
|
|
|
|
|
|
|
|
|
|
|
|
|
|
|
|
|
|
|
|
|
|
|
|
|
|
|
|
|
|
|
|
|
|
|
|
|
|
| |||||
Total Assets | $ | 4,411,865 |
|
|
|
|
|
| $ | 4,381,825 |
|
|
|
|
|
| $ | 4,357,678 |
|
|
|
|
|
| $ | 4,321,388 |
|
|
|
|
|
| $ | 4,266,775 |
|
|
|
|
|
|
|
|
|
|
|
|
|
|
|
|
|
|
|
|
|
|
|
|
|
|
|
|
|
|
|
|
|
|
|
|
|
|
|
|
|
|
|
| |||||
LIABILITIES: |
|
|
|
|
|
|
|
|
|
|
|
|
|
|
|
|
|
|
|
|
|
|
|
|
|
|
|
|
|
|
|
|
|
|
|
| |||||
Interest Bearing Deposits |
|
|
|
|
|
|
|
|
|
|
|
|
|
|
|
|
|
|
|
|
|
|
|
|
|
|
|
|
|
|
|
|
|
|
|
| |||||
NOW Accounts | $ | 1,228,928 |
| $ | 2,152 |
| 0.71 | % | $ | 1,133,733 |
| $ | 1,725 |
| 0.60 | % | $ | 1,016,475 |
| $ | 868 |
| 0.34 | % | $ | 1,033,190 |
| $ | 120 |
| 0.05 | % | $ | 1,079,906 |
| $ | 86 |
| 0.03 | % |
|
Money Market Accounts |
| 267,573 |
|
| 208 |
| 0.31 |
|
| 273,328 |
|
| 63 |
| 0.09 |
|
| 288,758 |
|
| 71 |
| 0.10 |
|
| 286,210 |
|
| 36 |
| 0.05 |
|
| 285,406 |
|
| 33 |
| 0.05 |
|
|
Savings Accounts |
| 629,388 |
|
| 76 |
| 0.05 |
|
| 641,153 |
|
| 80 |
| 0.05 |
|
| 643,640 |
|
| 80 |
| 0.05 |
|
| 628,472 |
|
| 77 |
| 0.05 |
|
| 599,359 |
|
| 72 |
| 0.05 |
|
|
Time Deposits |
| 89,675 |
|
| 52 |
| 0.24 |
|
| 92,385 |
|
| 34 |
| 0.15 |
|
| 94,073 |
|
| 33 |
| 0.14 |
|
| 95,132 |
|
| 33 |
| 0.14 |
|
| 97,054 |
|
| 33 |
| 0.14 |
|
|
Total Interest Bearing Deposits |
| 2,215,564 |
|
| 2,488 |
| 0.46 | % |
| 2,140,599 |
|
| 1,902 |
| 0.35 | % |
| 2,042,946 |
|
| 1,052 |
| 0.20 | % |
| 2,043,004 |
|
| 266 |
| 0.05 | % |
| 2,061,725 |
|
| 224 |
| 0.04 | % |
|
|
|
|
|
|
|
|
|
|
|
|
|
|
|
|
|
|
|
|
|
|
|
|
|
|
|
|
|
|
|
|
|
|
|
|
|
| |||||
Short-Term Borrowings |
| 47,109 |
|
| 461 |
| 3.97 | % |
| 50,844 |
|
| 690 |
| 5.38 | % |
| 46,679 |
|
| 536 |
| 4.56 | % |
| 31,782 |
|
| 343 |
| 4.33 | % |
| 32,353 |
|
| 192 |
| 2.40 | % |
|
Subordinated Notes Payable |
| 52,887 |
|
| 571 |
| 4.32 |
|
| 52,887 |
|
| 522 |
| 3.86 |
|
| 52,887 |
|
| 443 |
| 3.28 |
|
| 52,887 |
|
| 370 |
| 2.76 |
|
| 52,887 |
|
| 317 |
| 2.40 |
|
|
Other Long-Term Borrowings |
| 480 |
|
| 6 |
| 4.80 |
|
| 530 |
|
| 8 |
| 4.80 |
|
| 580 |
|
| 6 |
| 4.74 |
|
| 722 |
|
| 8 |
| 4.54 |
|
| 833 |
|
| 9 |
| 4.49 |
|
|
|
|
|
|
|
|
|
|
|
|
|
|
|
|
|
|
|
|
|
|
|
|
|
|
|
|
|
|
|
|
|
|
|
|
|
|
| |||||
Total Interest Bearing Liabilities |
| 2,316,040 |
| $ | 3,526 |
| 0.62 | % |
| 2,244,860 |
| $ | 3,122 |
| 0.55 | % |
| 2,143,092 |
| $ | 2,037 |
| 0.38 | % |
| 2,128,395 |
| $ | 987 |
| 0.19 | % |
| 2,147,798 |
| $ | 742 |
| 0.14 | % |
|
|
|
|
|
|
|
|
|
|
|
|
|
|
|
|
|
|
|
|
|
|
|
|
|
|
|
|
|
|
|
|
|
|
|
|
|
| |||||
Noninterest Bearing Deposits |
| 1,601,750 |
|
|
|
|
|
|
| 1,662,443 |
|
|
|
|
|
|
| 1,726,918 |
|
|
|
|
|
|
| 1,722,325 |
|
|
|
|
|
|
| 1,652,337 |
|
|
|
|
|
|
|
Other Liabilities |
| 81,206 |
|
|
|
|
|
|
| 84,585 |
|
|
|
|
|
|
| 98,501 |
|
|
|
|
|
|
| 87,207 |
|
|
|
|
|
|
| 72,166 |
|
|
|
|
|
|
|
|
|
|
|
|
|
|
|
|
|
|
|
|
|
|
|
|
|
|
|
|
|
|
|
|
|
|
|
|
|
|
|
|
|
|
|
| |||||
Total Liabilities |
| 3,998,996 |
|
|
|
|
|
|
| 3,991,888 |
|
|
|
|
|
|
| 3,968,511 |
|
|
|
|
|
|
| 3,937,927 |
|
|
|
|
|
|
| 3,872,301 |
|
|
|
|
|
|
|
Temporary Equity |
| 8,802 |
|
|
|
|
|
|
| 9,367 |
|
|
|
|
|
|
| 9,862 |
|
|
|
|
|
|
| 10,096 |
|
|
|
|
|
|
| 10,518 |
|
|
|
|
|
|
|
|
|
|
|
|
|
|
|
|
|
|
|
|
|
|
|
|
|
|
|
|
|
|
|
|
|
|
|
|
|
|
|
|
|
|
|
| |||||
SHAREOWNERS' EQUITY: |
| 404,067 |
|
|
|
|
|
|
| 380,570 |
|
|
|
|
|
|
| 379,305 |
|
|
|
|
|
|
| 373,365 |
|
|
|
|
|
|
| 383,956 |
|
|
|
|
|
|
|
|
|
|
|
|
|
|
|
|
|
|
|
|
|
|
|
|
|
|
|
|
|
|
|
|
|
|
|
|
|
|
|
|
|
|
|
| |||||
Total Liabilities, Temporary Equity and Shareowners' Equity | $ | 4,411,865 |
|
|
|
|
|
| $ | 4,381,825 |
|
|
|
|
|
| $ | 4,357,678 |
|
|
|
|
|
| $ | 4,321,388 |
|
|
|
|
|
| $ | 4,266,775 |
|
|
|
|
|
|
|
|
|
|
|
|
|
|
|
|
|
|
|
|
|
|
|
|
|
|
|
|
|
|
|
|
|
|
|
|
|
|
|
|
|
|
|
| |||||
Interest Rate Spread |
|
| $ | 40,489 |
| 3.77 | % |
|
| $ | 38,192 |
| 3.52 | % |
|
| $ | 33,410 |
| 3.13 | % |
|
| $ | 28,409 |
| 2.78 | % |
|
| $ | 24,774 |
| 2.49 | % |
| |||||
|
|
|
|
|
|
|
|
|
|
|
|
|
|
|
|
|
|
|
|
|
|
|
|
|
|
|
|
|
|
|
|
|
|
|
|
| |||||
Interest Income and Rate Earned(1) |
|
|
| 44,015 |
| 4.39 |
|
|
|
| 41,314 |
| 4.07 |
|
|
|
| 35,447 |
| 3.51 |
|
|
|
| 29,396 |
| 2.97 |
|
|
|
| 25,516 |
| 2.63 |
|
| |||||
Interest Expense and Rate Paid(2) |
|
|
| 3,526 |
| 0.35 |
|
|
|
| 3,122 |
| 0.31 |
|
|
|
| 2,037 |
| 0.20 |
|
|
|
| 987 |
| 0.10 |
|
|
|
| 742 |
| 0.08 |
|
| |||||
|
|
|
|
|
|
|
|
|
|
|
|
|
|
|
|
|
|
|
|
|
|
|
|
|
|
|
|
|
|
|
|
|
|
|
|
| |||||
Net Interest Margin |
|
| $ | 40,489 |
| 4.04 | % |
|
| $ | 38,192 |
| 3.76 | % |
|
| $ | 33,410 |
| 3.31 | % |
|
| $ | 28,409 |
| 2.87 | % |
|
| $ | 24,774 |
| 2.55 | % |
| |||||
|
|
|
|
|
|
|
|
|
|
|
|
|
|
|
|
|
|
|
|
|
|
|
|
|
|
|
|
|
|
|
|
|
|
|
|
| |||||
(1) Interest and average rates are calculated on a tax-equivalent basis using a 21% Federal tax rate. |
| ||||||||||||||||||||||||||||||||||||||||
(2) Rate calculated based on average earning assets. |
|
| |||||||||||||||||||||||||||||||||||||||
For Information Contact:
Jep Larkin
Executive Vice President and Chief Financial Officer
850.402.8450
Photos accompanying this announcement are available at:
https://www.globenewswire.com/NewsRoom/AttachmentNg/eb26db8a-8d29-4e73-b20d-b8fdbba8bab3
https://www.globenewswire.com/NewsRoom/AttachmentNg/9c482b4a-94ca-4ecf-8c46-560f2e77353f
https://www.globenewswire.com/NewsRoom/AttachmentNg/5028b43a-7c88-471f-acaf-5db136b12fcf
https://www.globenewswire.com/NewsRoom/AttachmentNg/851f7c44-9fc9-4eb1-a844-b1ec546c23aa

