CarMax (KMX): An In-Depth Look at the Stock's Intrinsic Value
CarMax Inc (NYSE:KMX) has seen a daily gain of 4.11% and a 3-month gain of 5.11%. With an Earnings Per Share (EPS) of 2.91, the question arises: is the stock modestly undervalued? This article aims to provide an in-depth analysis of CarMax's valuation, encouraging readers to delve into the following financial assessment.
Company Introduction
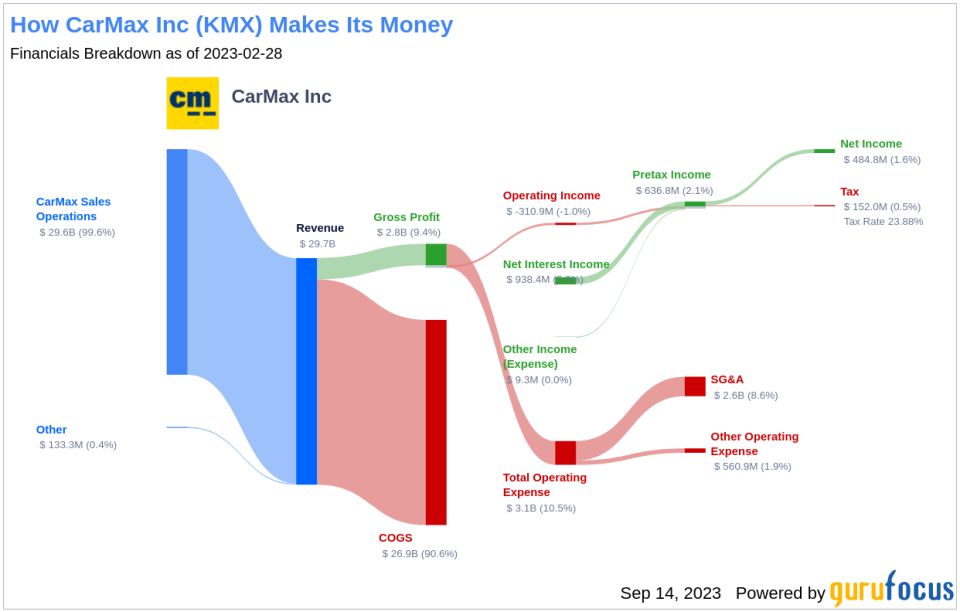
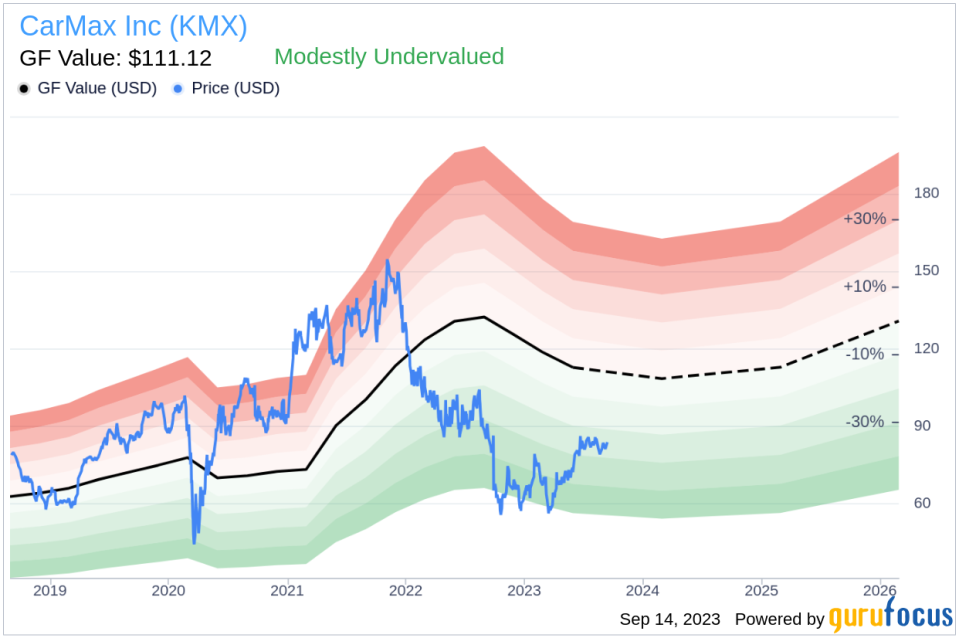
CarMax Inc (NYSE:KMX) sells, finances, and services used and new cars through a chain of about 240 retail stores. Formed in 1993 as a unit of Circuit City, it became an independent company in late 2002. With a current stock price of $83.85 per share and a market cap of $13.30 billion, CarMax's stock is believed to be modestly undervalued compared to the GF Value of $111.12.
Understanding the GF Value
The GF Value is a proprietary measure that represents the current intrinsic value of a stock. It is calculated based on historical trading multiples, a GuruFocus adjustment factor, and future business performance estimates. The GF Value Line provides an overview of the fair value at which the stock should ideally be traded. If the stock price is significantly above the GF Value Line, it is overvalued, and its future return is likely to be poor. Conversely, if it is significantly below the GF Value Line, its future return will likely be higher.
Considering CarMax's current price and market cap, the stock is believed to be modestly undervalued. This suggests that the long-term return of its stock is likely to be higher than its business growth.
Link: These companies may deliver higher future returns at reduced risk.
Financial Strength
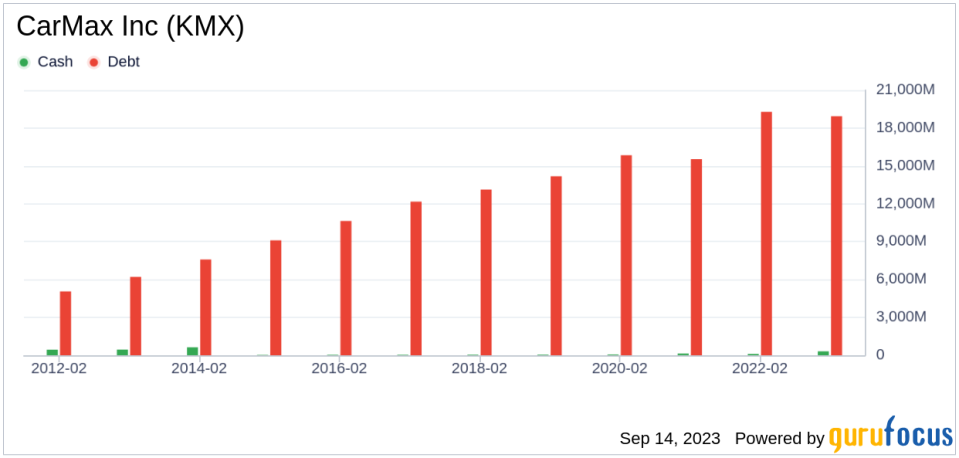
Investing in companies with poor financial strength has a higher risk of permanent loss of capital. Thus, it is crucial to review the financial strength of a company before deciding to buy its stock. CarMax's cash-to-debt ratio of 0.01 is worse than 98.28% of the companies in the Vehicles & Parts industry, indicating that the financial strength of CarMax is poor.
Profitability and Growth
Investing in profitable companies poses less risk, especially those that have consistently demonstrated profitability. CarMax has been profitable 10 out of the past 10 years. However, its operating margin of -1.07% ranks worse than 81.4% of the companies in the Vehicles & Parts industry.
Growth is a crucial factor in the valuation of a company. The 3-year average annual revenue growth rate of CarMax is 15.1%, which ranks better than 75.52% of the companies in the Vehicles & Parts industry. However, the 3-year average EBITDA growth rate is -8.5%, which ranks worse than 77.77% of the companies in the industry.
ROIC vs WACC
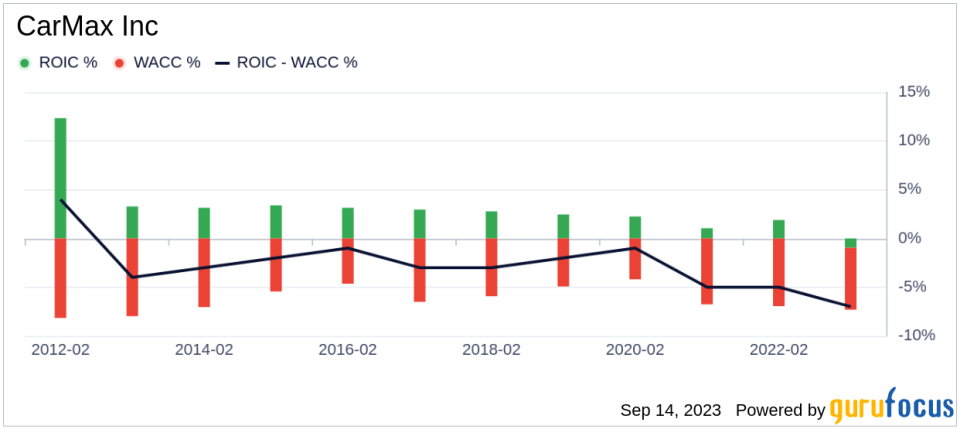
Comparing a company's return on invested capital (ROIC) to the weighted average cost of capital (WACC) is another method of determining its profitability. CarMax's ROIC is -0.92, and its WACC is 5.54. This implies that the company is not creating value for shareholders.
Conclusion
In conclusion, CarMax's stock is believed to be modestly undervalued. Despite its poor financial condition, its profitability is strong. However, its growth ranks worse than 77.77% of the companies in the Vehicles & Parts industry. To learn more about CarMax stock, you can check out its 30-Year Financials here.
To find out the high-quality companies that may deliver above-average returns, please check out the GuruFocus High Quality Low Capex Screener.
This article first appeared on GuruFocus.
